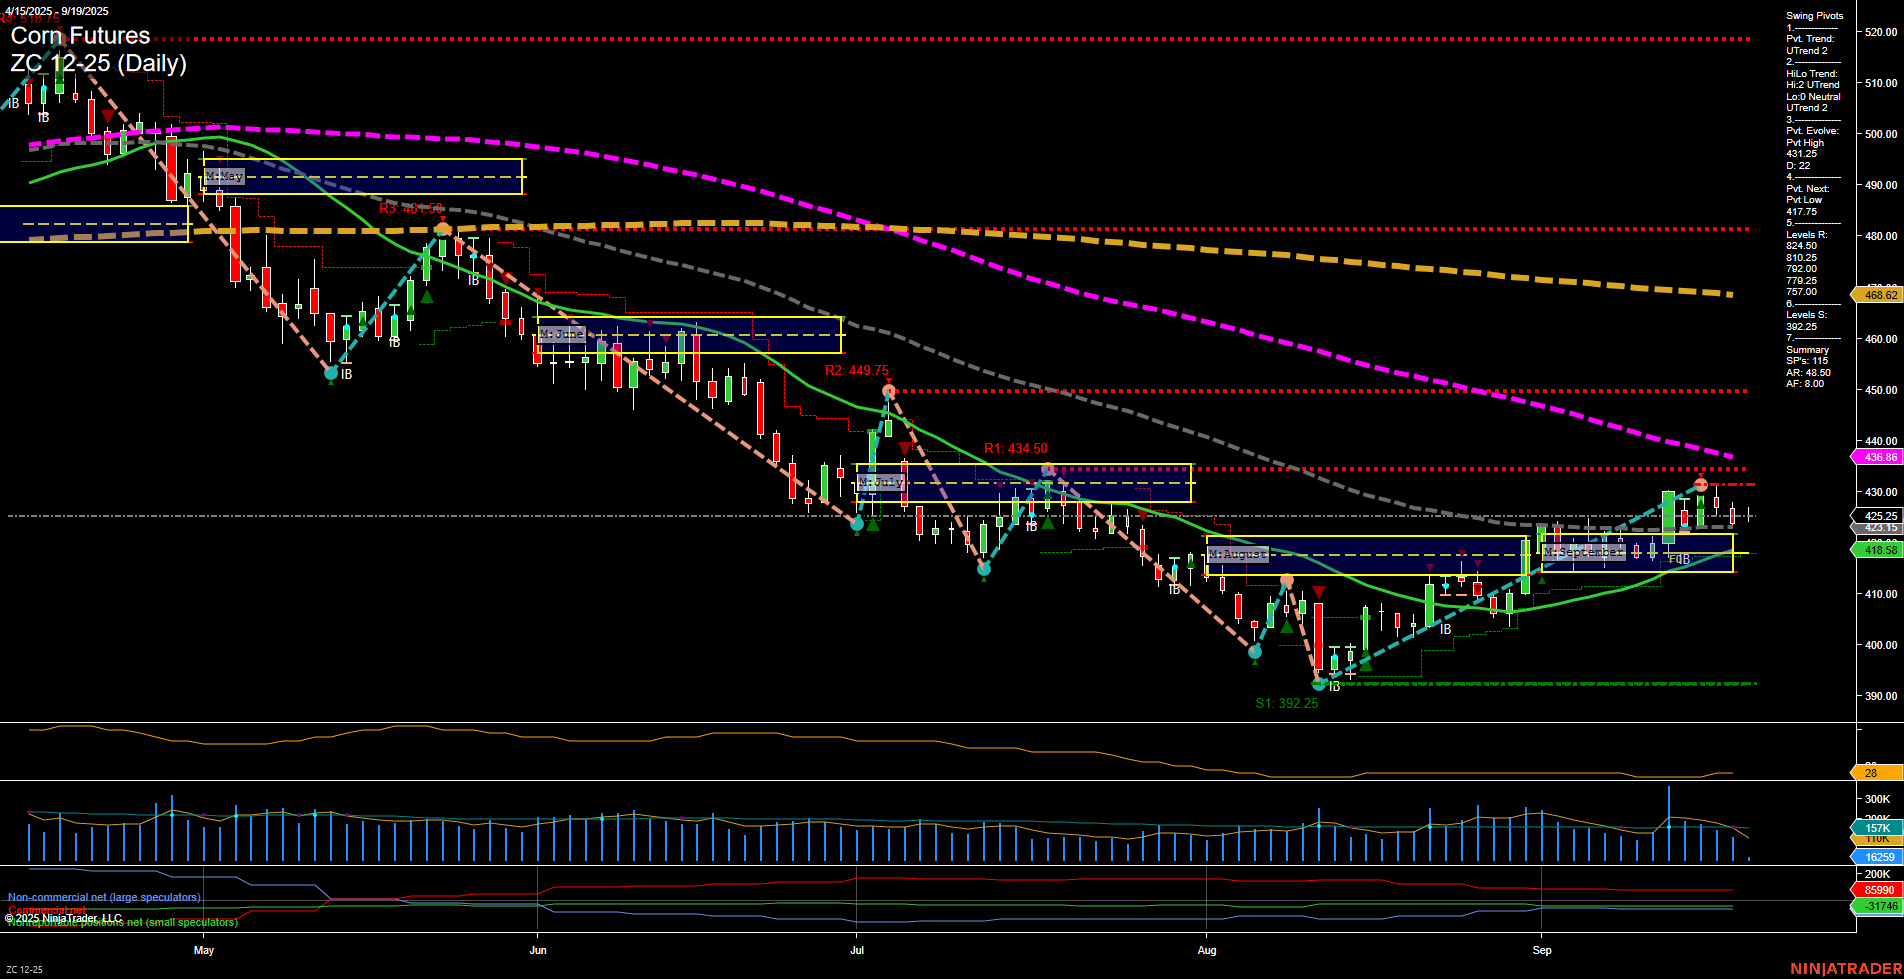
ZC Corn Futures Daily Chart Analysis: 2025-Sep-19 07:20 CT
Price Action
- Last: 425.25,
- Bars: Medium,
- Mom: Momentum average.
WSFG Weekly
- Short-Term
- WSFG Current: -7%
- F0%/NTZ' Bias: Price Below,
- WSFG Trend: Down.
MSFG Month Sep
- Intermediate-Term
- MSFG Current: 22%
- F0%/NTZ' Bias: Price Above,
- MSFG Trend: Up.
YSFG Year 2025
- Long-Term
- YSFG Current: -45%
- F0%/NTZ' Bias: Price Below,
- YSFG Trend: Down.
Swing Pivots
- (Short-Term) 1. Pvt. Trend: UTrend,
- (Intermediate-Term) 2. HiLo Trend: UTrend,
- 3. Pvt. Evolve: Pvt high 431.25,
- 4. Pvt. Next: Pvt low 417.75,
- 5. Levels R: 434.5, 449.75, 464.65, 479, 492.05, 510.25,
- 6. Levels S: 392.25.
Daily Benchmarks
- (Short-Term) 5 Day: 425.15 Up Trend,
- (Short-Term) 10 Day: 421.85 Up Trend,
- (Intermediate-Term) 20 Day: 418.58 Up Trend,
- (Intermediate-Term) 55 Day: 436.86 Down Trend,
- (Long-Term) 100 Day: 468.62 Down Trend,
- (Long-Term) 200 Day: 488.62 Down Trend.
Additional Metrics
Recent Trade Signals
- 18 Sep 2025: Short ZC 12-25 @ 423.5 Signals.USAR.TR120
- 18 Sep 2025: Short ZC 12-25 @ 424.75 Signals.USAR-WSFG
- 16 Sep 2025: Long ZC 12-25 @ 424.75 Signals.USAR-MSFG
Overall Rating
- Short-Term: Neutral,
- Intermediate-Term: Bullish,
- Long-Term: Bearish.
Key Insights Summary
Corn futures have recently shifted into a short-term uptrend, as indicated by the swing pivot and short-term moving averages, with price action consolidating above the monthly NTZ and the 20-day benchmark. However, the weekly and yearly session fib grids remain in a downtrend, and long-term moving averages are still trending lower, reflecting persistent bearish pressure on a broader horizon. The recent trade signals show mixed direction, with both short and long entries triggered in the last few sessions, highlighting a choppy environment. Resistance is clustered near 434.5 and 449.75, while support is well below at 392.25, suggesting a wide trading range. Volatility is moderate, and volume remains healthy. The market appears to be in a transitional phase, with intermediate-term bullish momentum facing headwinds from longer-term bearish structure, and price currently testing key resistance levels after a recovery from summer lows.
Chart Analysis ATS AI Generated: 2025-09-19 07:20 for Informational use only, not trading advice. Terms and Risk Disclosure Copyright © 2025. Algo Trading Systems LLC.
