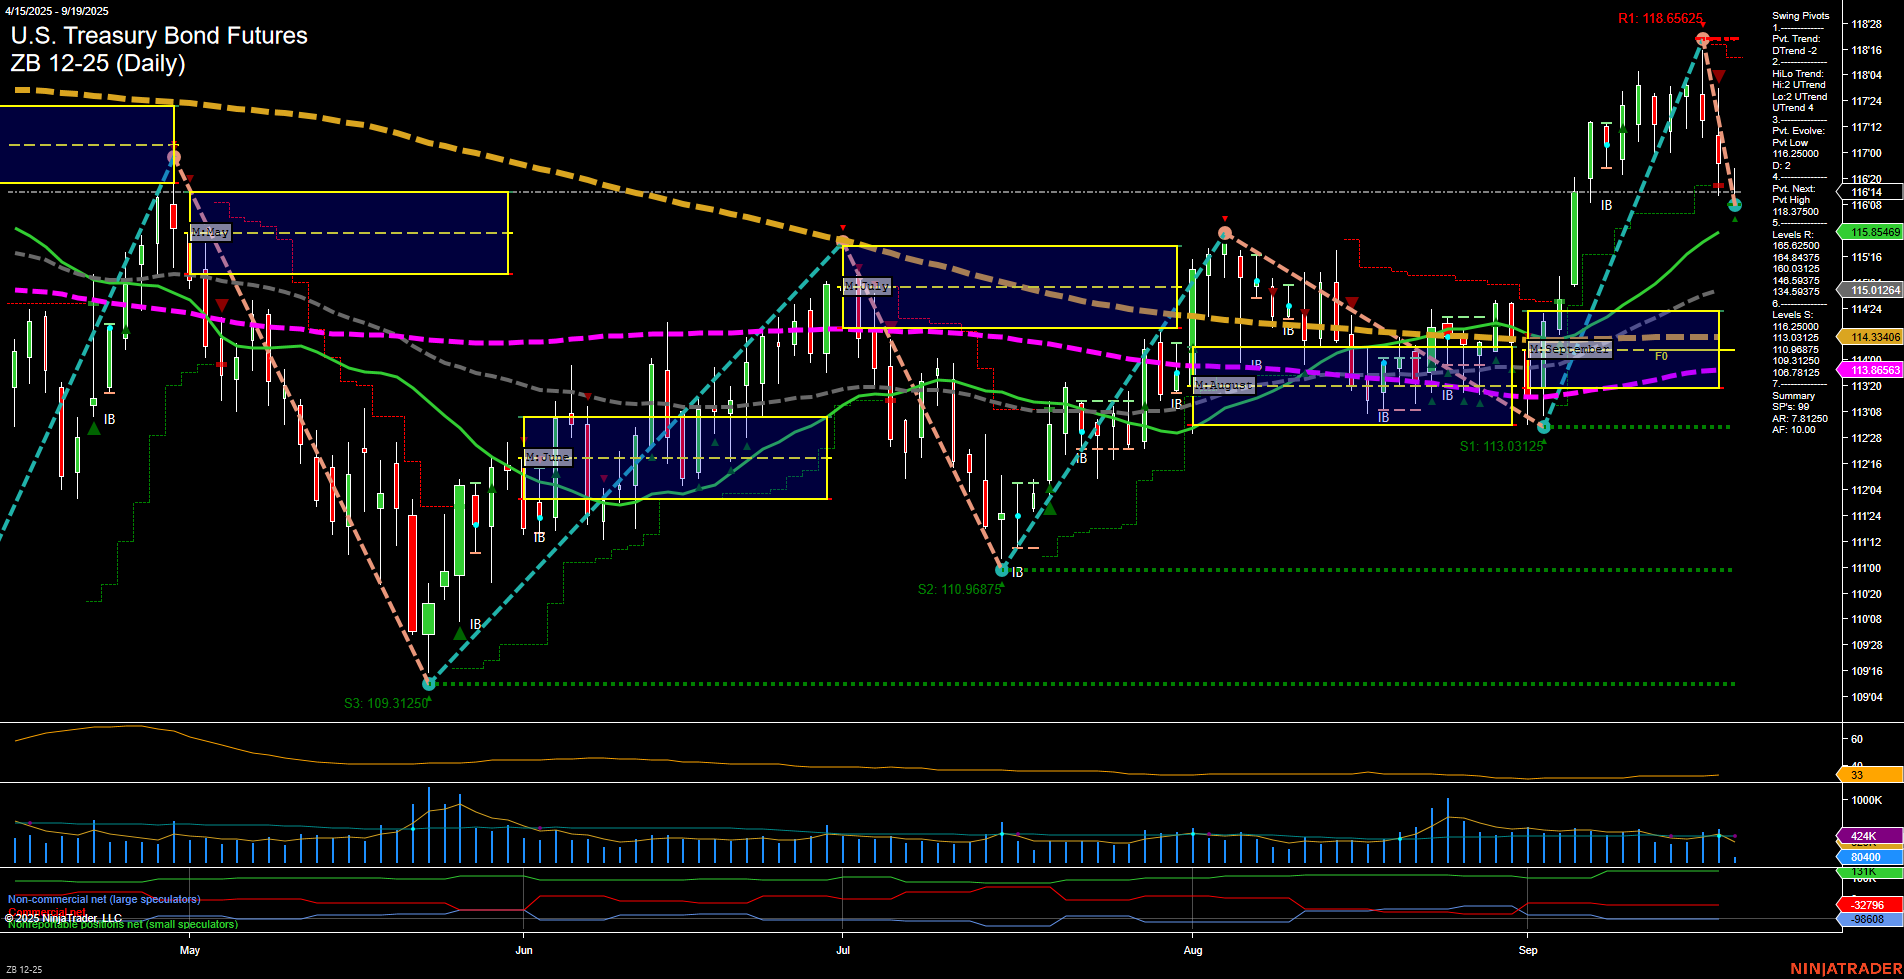
ZB U.S. Treasury Bond Futures Daily Chart Analysis: 2025-Sep-19 07:19 CT
Price Action
- Last: 115.85469,
- Bars: Large,
- Mom: Momentum fast.
WSFG Weekly
- Short-Term
- WSFG Current: NA%
- F0%/NTZ' Bias: Price Neutral,
- WSFG Trend: Neutral.
MSFG Month Sep
- Intermediate-Term
- MSFG Current: NA%
- F0%/NTZ' Bias: Price Neutral,
- MSFG Trend: Neutral.
YSFG Year 2025
- Long-Term
- YSFG Current: NA%
- F0%/NTZ' Bias: Price Neutral,
- YSFG Trend: Neutral.
Swing Pivots
- (Short-Term) 1. Pvt. Trend: DTrend,
- (Intermediate-Term) 2. HiLo Trend: UTrend,
- 3. Pvt. Evolve: Pvt Low 116.240,
- 4. Pvt. Next: Pvt High 118.375,
- 5. Levels R: 118.656, 118.375, 117.724,
- 6. Levels S: 115.854, 115.012, 114.334, 113.865, 113.031, 110.968, 109.312.
Daily Benchmarks
- (Short-Term) 5 Day: 117.24 Down Trend,
- (Short-Term) 10 Day: 116.84 Down Trend,
- (Intermediate-Term) 20 Day: 115.85 Up Trend,
- (Intermediate-Term) 55 Day: 114.33 Up Trend,
- (Long-Term) 100 Day: 113.87 Up Trend,
- (Long-Term) 200 Day: 117.26 Down Trend.
Additional Metrics
Overall Rating
- Short-Term: Bearish,
- Intermediate-Term: Bullish,
- Long-Term: Neutral.
Key Insights Summary
The ZB U.S. Treasury Bond Futures daily chart currently reflects a fast momentum move with large bars, indicating heightened volatility and active price swings. The short-term swing pivot trend has shifted to a downtrend, confirmed by both the 5-day and 10-day moving averages trending lower. However, the intermediate-term (20-day, 55-day, and 100-day) moving averages remain in an uptrend, and the HiLo swing pivot trend is still up, suggesting underlying bullishness on a broader time frame. The 200-day moving average is in a downtrend, keeping the long-term outlook neutral as price consolidates between major support and resistance levels. The ATR and volume metrics confirm increased activity, likely driven by recent macroeconomic news or rate expectations. Price is currently testing support near 115.85, with significant resistance overhead at 118.65 and 118.37. The market is in a corrective pullback phase within a larger bullish structure, with potential for further volatility as it approaches key pivot levels. Overall, the short-term bias is bearish due to the recent sharp reversal, but the intermediate-term structure remains constructive, while the long-term trend is still undecided.
Chart Analysis ATS AI Generated: 2025-09-19 07:19 for Informational use only, not trading advice. Terms and Risk Disclosure Copyright © 2025. Algo Trading Systems LLC.
