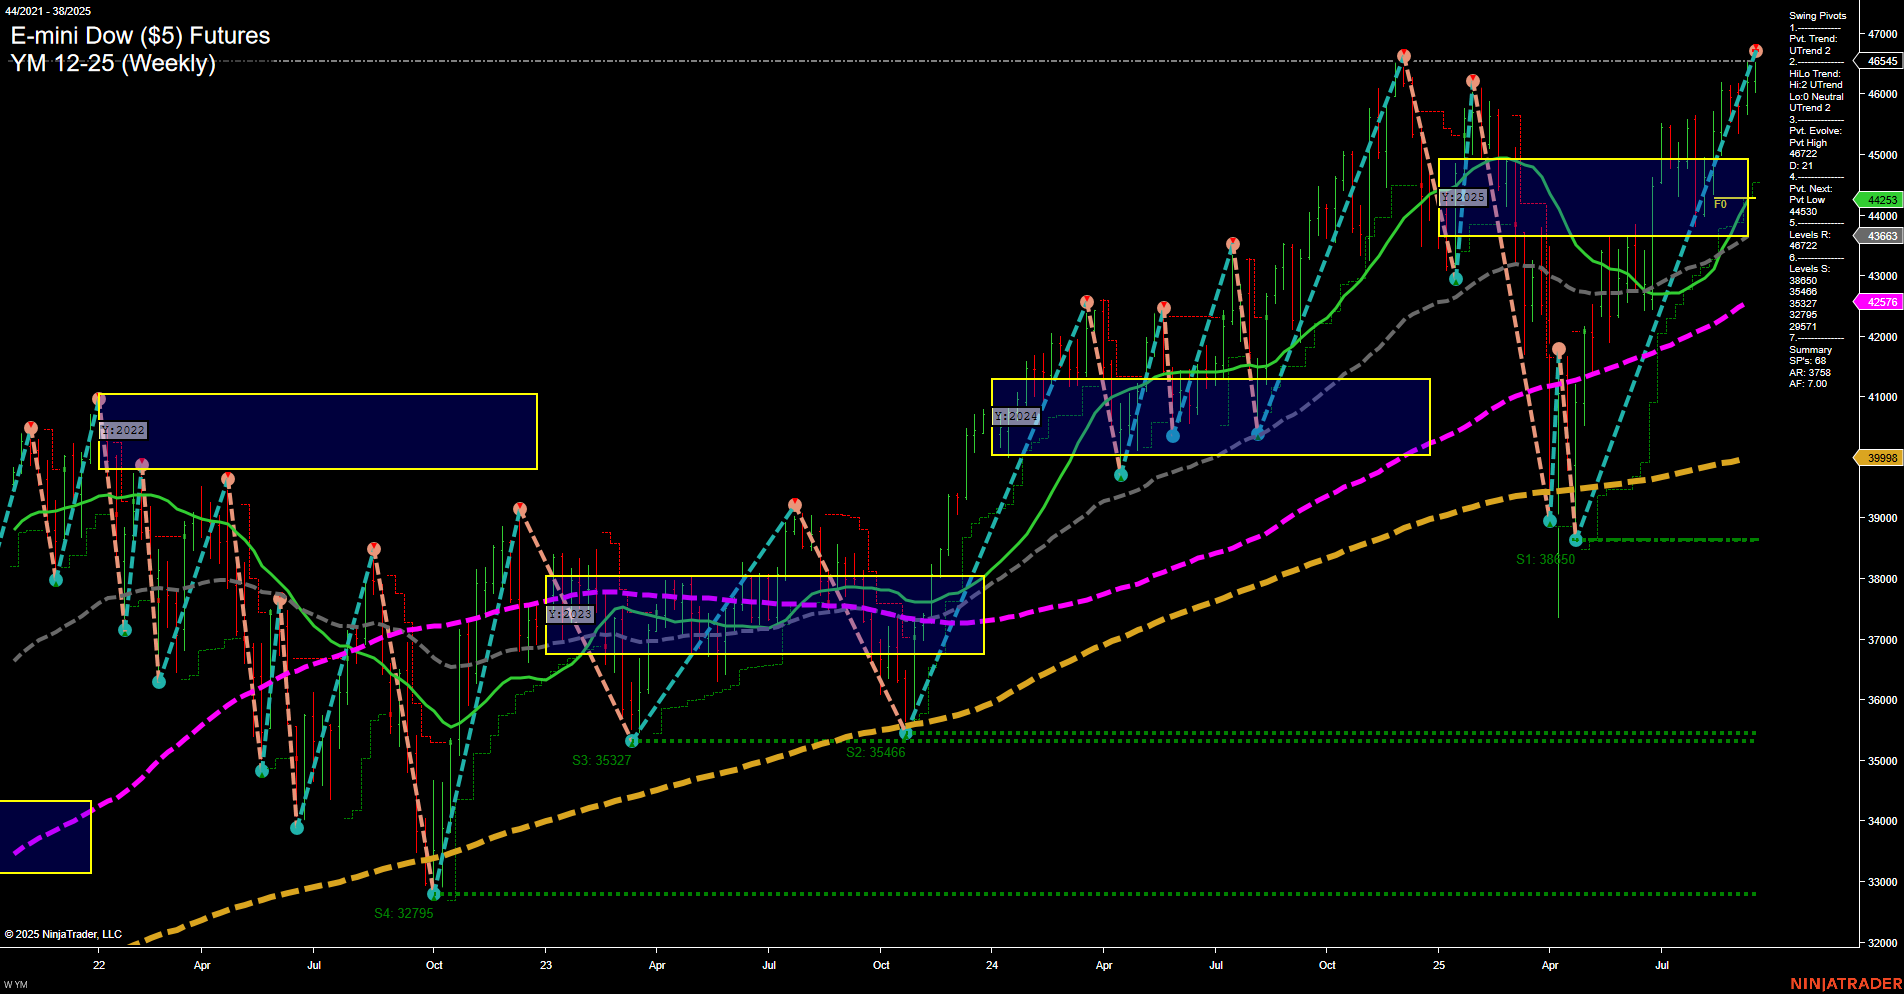
YM E-mini Dow ($5) Futures Weekly Chart Analysis: 2025-Sep-19 07:19 CT
Price Action
- Last: 46545,
- Bars: Large,
- Mom: Momentum fast.
WSFG Weekly
- Short-Term
- WSFG Current: 38%
- F0%/NTZ' Bias: Price Above,
- WSFG Trend: Up.
MSFG Month Sep
- Intermediate-Term
- MSFG Current: 31%
- F0%/NTZ' Bias: Price Above,
- MSFG Trend: Up.
YSFG Year 2025
- Long-Term
- YSFG Current: 35%
- F0%/NTZ' Bias: Price Above,
- YSFG Trend: Up.
Swing Pivots
- (Short-Term) 1. Pvt. Trend: UTrend,
- (Intermediate-Term) 2. HiLo Trend: UTrend,
- 3. Pvt. Evolve: Pvt high 46545,
- 4. Pvt. Next: Pvt low 44251,
- 5. Levels R: 46722, 46545, 45430,
- 6. Levels S: 43663, 38450, 35466, 35327, 32795.
Weekly Benchmarks
- (Intermediate-Term) 5 Week: 45430 Up Trend,
- (Intermediate-Term) 10 Week: 44000 Up Trend,
- (Long-Term) 20 Week: 44253 Up Trend,
- (Long-Term) 55 Week: 42576 Up Trend,
- (Long-Term) 100 Week: 39998 Up Trend,
- (Long-Term) 200 Week: 39998 Up Trend.
Recent Trade Signals
- 17 Sep 2025: Long YM 12-25 @ 46407 Signals.USAR-MSFG
- 17 Sep 2025: Long YM 12-25 @ 46372 Signals.USAR-WSFG
- 17 Sep 2025: Long YM 12-25 @ 46460 Signals.USAR.TR120
Overall Rating
- Short-Term: Bullish,
- Intermediate-Term: Bullish,
- Long-Term: Bullish.
Key Insights Summary
The YM E-mini Dow futures weekly chart is showing strong bullish momentum across all timeframes. Price is at new highs with large, fast-moving bars, and all major session fib grid trends (weekly, monthly, yearly) are up with price holding above their respective NTZ/F0% levels. Swing pivots confirm an uptrend in both short- and intermediate-term, with the most recent pivot high at 46545 and the next key support at 44251. Resistance levels are being tested and broken, while support levels remain well below current price, indicating a strong trend continuation. All benchmark moving averages are trending upward, reinforcing the bullish structure. Recent trade signals are aligned long, confirming the prevailing trend. The market has recovered from previous pullbacks and is exhibiting a classic trend continuation pattern, with higher highs and higher lows, and no immediate signs of reversal or exhaustion.
Chart Analysis ATS AI Generated: 2025-09-19 07:19 for Informational use only, not trading advice. Terms and Risk Disclosure Copyright © 2025. Algo Trading Systems LLC.
