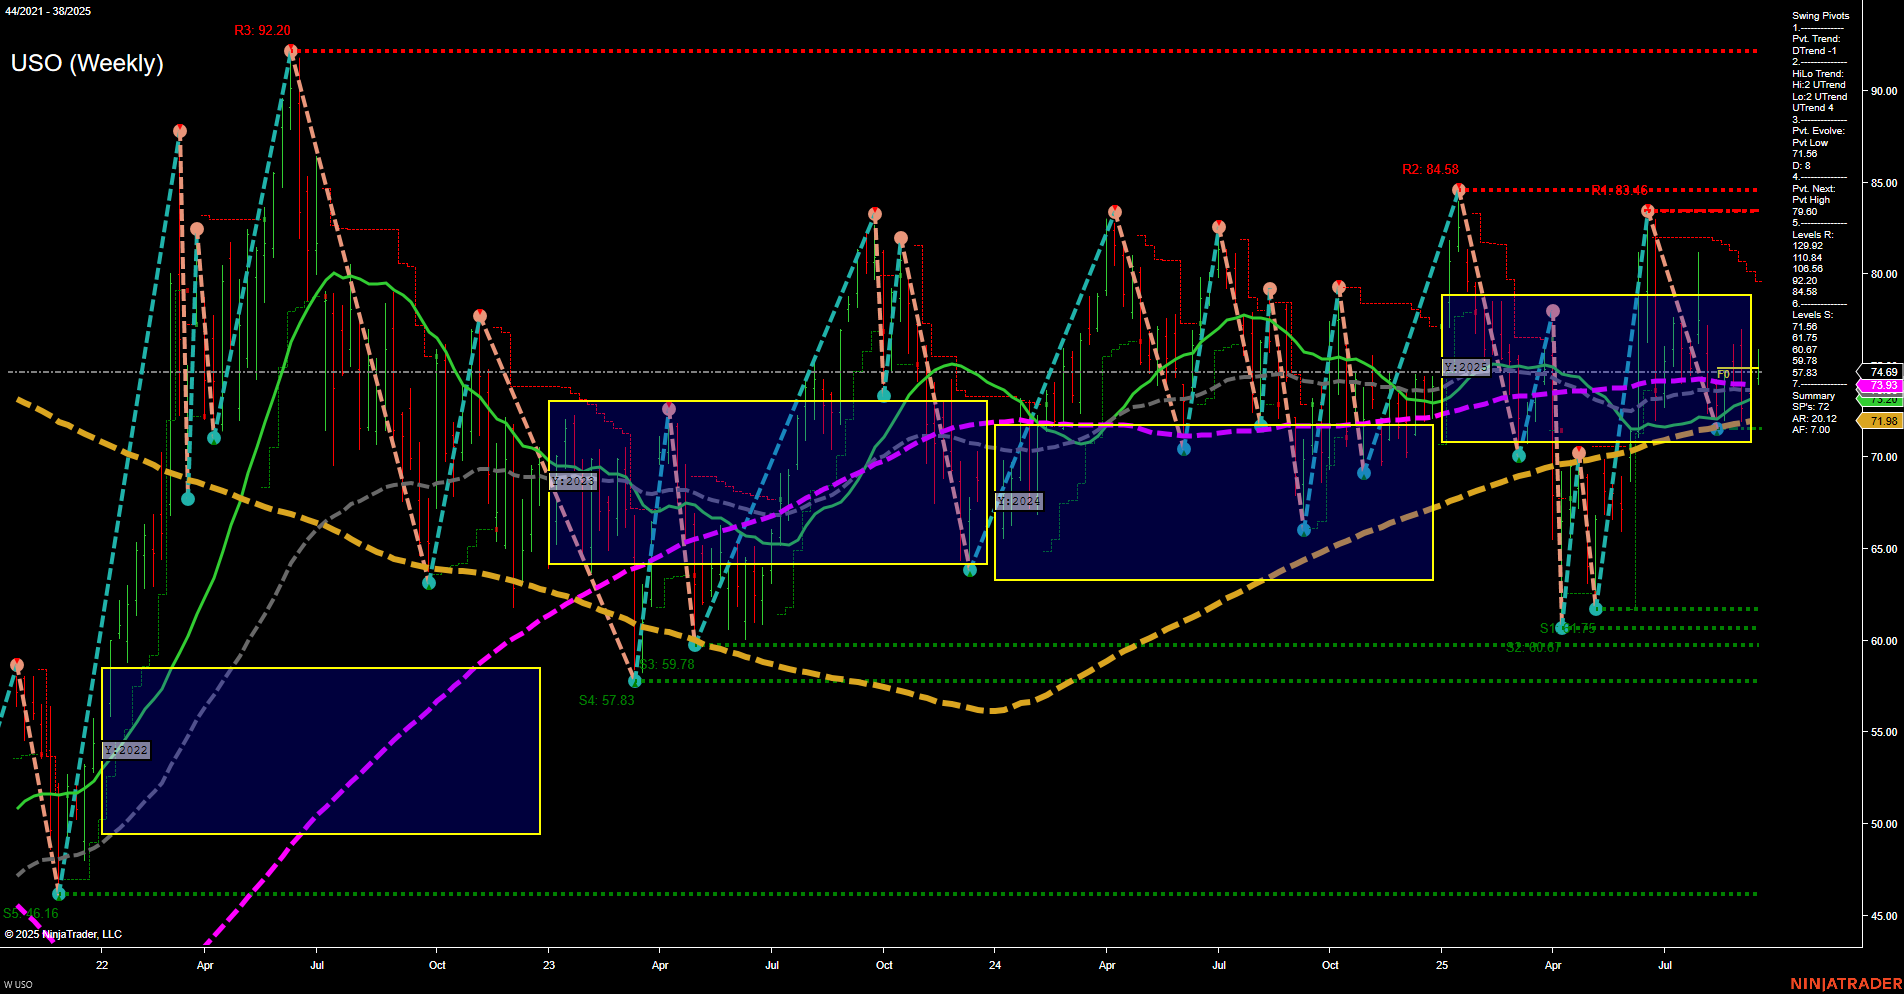
USO United States Oil Fund LP Weekly Chart Analysis: 2025-Sep-19 07:18 CT
Price Action
- Last: 74.69,
- Bars: Medium,
- Mom: Momentum slow.
WSFG Weekly
- Short-Term
- WSFG Current: NA%
- F0%/NTZ' Bias: Price Neutral,
- WSFG Trend: Neutral.
MSFG Month Sep
- Intermediate-Term
- MSFG Current: NA%
- F0%/NTZ' Bias: Price Neutral,
- MSFG Trend: Neutral.
YSFG Year 2025
- Long-Term
- YSFG Current: NA%
- F0%/NTZ' Bias: Price Neutral,
- YSFG Trend: Neutral.
Swing Pivots
- (Short-Term) 1. Pvt. Trend: DTrend-1,
- (Intermediate-Term) 2. HiLo Trend: UTrend 4,
- 3. Pvt. Evolve: Pvt low 66.75,
- 4. Pvt. Next: Pvt high 84.58,
- 5. Levels R: 92.20, 84.58, 83.45,
- 6. Levels S: 66.75, 60.67, 59.78, 57.83, 46.16.
Weekly Benchmarks
- (Intermediate-Term) 5 Week: 73.97 Down Trend,
- (Intermediate-Term) 10 Week: 73.53 Down Trend,
- (Long-Term) 20 Week: 74.69 Up Trend,
- (Long-Term) 55 Week: 71.98 Up Trend,
- (Long-Term) 100 Week: 74.31 Down Trend,
- (Long-Term) 200 Week: 71.98 Up Trend.
Overall Rating
- Short-Term: Bearish,
- Intermediate-Term: Bullish,
- Long-Term: Neutral.
Key Insights Summary
USO is currently trading in a broad consolidation range, with price action showing medium-sized bars and slow momentum, indicating a lack of strong directional conviction. The short-term swing pivot trend is down, supported by both the 5- and 10-week moving averages trending lower, while the intermediate-term HiLo trend remains up, suggesting underlying support from recent higher lows. The long-term moving averages are mixed, with the 20- and 55-week MAs trending up but the 100-week MA still in a downtrend, reflecting a market in transition. Key resistance levels are clustered at 83.45–92.20, while support is well-defined at 66.75 and below, highlighting a wide trading band. The neutral stance of the Fib grid trends across all timeframes further reinforces the current range-bound environment. Overall, the chart suggests a market in consolidation, with short-term weakness but intermediate-term resilience, and no clear long-term breakout or breakdown signal at this stage.
Chart Analysis ATS AI Generated: 2025-09-19 07:18 for Informational use only, not trading advice. Terms and Risk Disclosure Copyright © 2025. Algo Trading Systems LLC.
