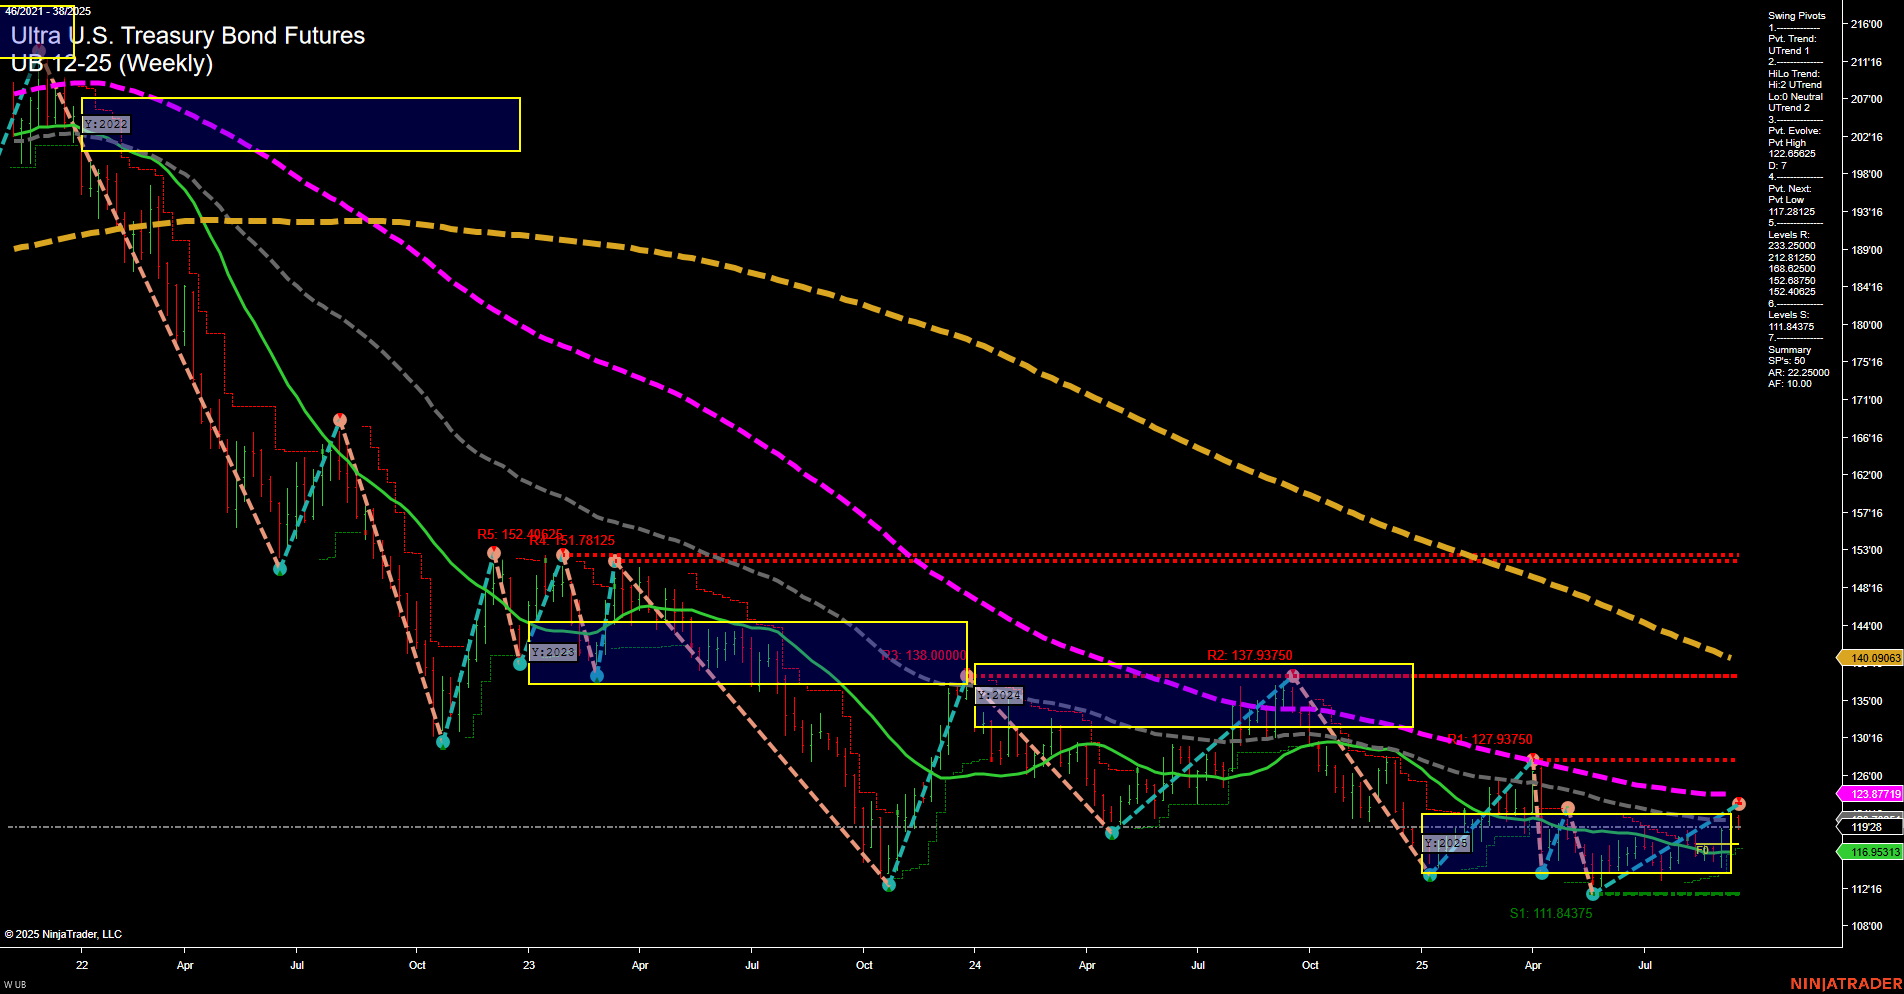
UB Ultra U.S. Treasury Bond Futures Weekly Chart Analysis: 2025-Sep-19 07:17 CT
Price Action
- Last: 140.90625,
- Bars: Medium,
- Mom: Momentum slow.
WSFG Weekly
- Short-Term
- WSFG Current: -52%
- F0%/NTZ' Bias: Price Below,
- WSFG Trend: Down.
MSFG Month Sep
- Intermediate-Term
- MSFG Current: 72%
- F0%/NTZ' Bias: Price Above,
- MSFG Trend: Up.
YSFG Year 2025
- Long-Term
- YSFG Current: 5%
- F0%/NTZ' Bias: Price Above,
- YSFG Trend: Up.
Swing Pivots
- (Short-Term) 1. Pvt. Trend: DTrend,
- (Intermediate-Term) 2. HiLo Trend: UTrend,
- 3. Pvt. Evolve: Pvt High 142.0625,
- 4. Pvt. Next: Pvt Low 111.84375,
- 5. Levels R: 218.25000, 212.81250, 202.06250, 152.40625, 151.78125, 137.93750,
- 6. Levels S: 111.84375.
Weekly Benchmarks
- (Intermediate-Term) 5 Week: 119.928 Up Trend,
- (Intermediate-Term) 10 Week: 116.95313 Up Trend,
- (Long-Term) 20 Week: 123.87179 Up Trend,
- (Long-Term) 55 Week: 140.90625 Down Trend,
- (Long-Term) 100 Week: 151.78125 Down Trend,
- (Long-Term) 200 Week: 175.93750 Down Trend.
Recent Trade Signals
- 18 Sep 2025: Short UB 12-25 @ 120.40625 Signals.USAR-WSFG
- 17 Sep 2025: Short UB 12-25 @ 120.90625 Signals.USAR.TR120
Overall Rating
- Short-Term: Bearish,
- Intermediate-Term: Bullish,
- Long-Term: Bearish.
Key Insights Summary
The UB Ultra U.S. Treasury Bond Futures weekly chart shows a market in transition. Short-term momentum remains slow and the WSFG trend is down, with price trading below the NTZ center, confirming a bearish short-term bias. Recent short trade signals reinforce this view. However, the intermediate-term picture is more constructive, with the MSFG trend up and price above the monthly NTZ, supported by rising 5- and 10-week moving averages. The long-term trend, as indicated by the yearly session fib grid and major moving averages (55, 100, 200 week), remains bearish, with price still well below these benchmarks and resistance levels stacked above. Swing pivots highlight a recent high at 142.0625 and a key support at 111.84375, suggesting a wide trading range. The market appears to be consolidating after a prolonged downtrend, with potential for countertrend rallies, but the dominant long-term structure is still bearish. Volatility is moderate, and price action is choppy, reflecting indecision between short-term sellers and intermediate-term buyers.
Chart Analysis ATS AI Generated: 2025-09-19 07:18 for Informational use only, not trading advice. Terms and Risk Disclosure Copyright © 2025. Algo Trading Systems LLC.
