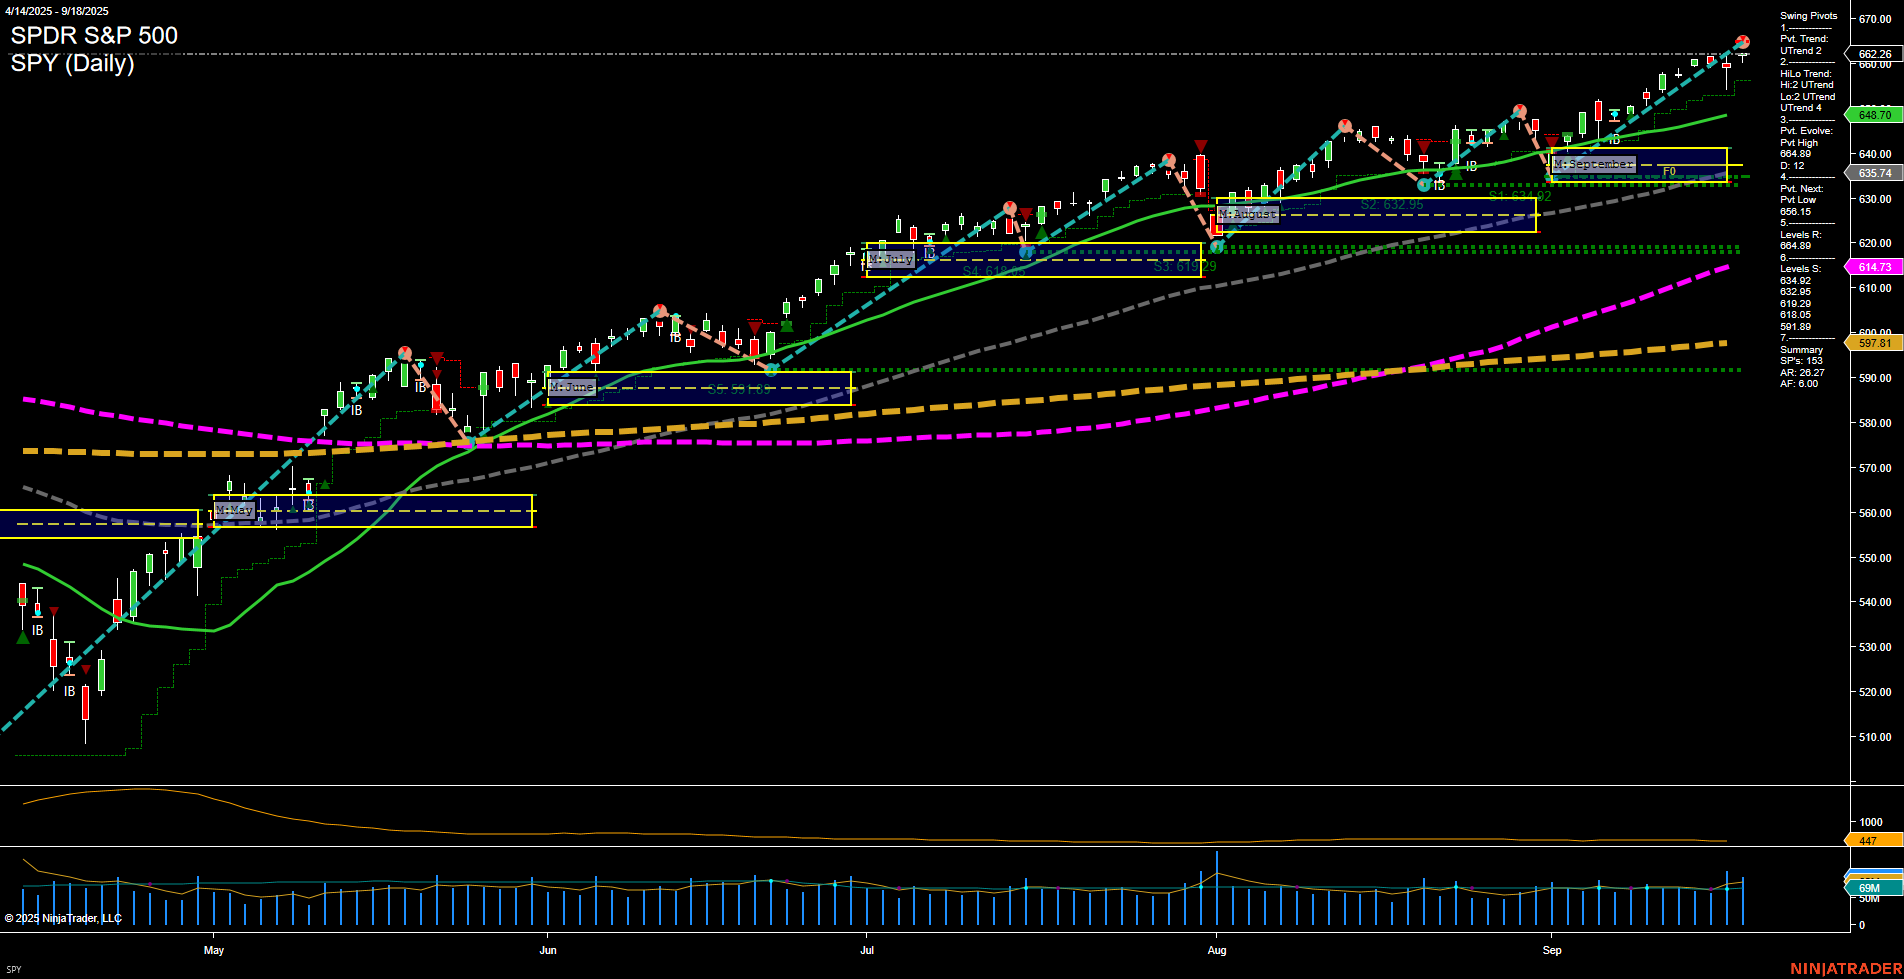
SPY SPDR S&P 500 Daily Chart Analysis: 2025-Sep-19 07:16 CT
Price Action
- Last: 662.26,
- Bars: Medium,
- Mom: Momentum average.
WSFG Weekly
- Short-Term
- WSFG Current: NA%
- F0%/NTZ' Bias: Price Neutral,
- WSFG Trend: Neutral.
MSFG Month Sep
- Intermediate-Term
- MSFG Current: NA%
- F0%/NTZ' Bias: Price Neutral,
- MSFG Trend: Neutral.
YSFG Year 2025
- Long-Term
- YSFG Current: NA%
- F0%/NTZ' Bias: Price Neutral,
- YSFG Trend: Neutral.
Swing Pivots
- (Short-Term) 1. Pvt. Trend: UTrend,
- (Intermediate-Term) 2. HiLo Trend: UTrend,
- 3. Pvt. Evolve: Pvt high 662.26,
- 4. Pvt. Next: Pvt low 635.74,
- 5. Levels R: 662.26, 660.71, 655.15, 649.89,
- 6. Levels S: 635.74, 632.95, 621.09, 619.96, 618.29, 617.09.
Daily Benchmarks
- (Short-Term) 5 Day: 644.70 Up Trend,
- (Short-Term) 10 Day: 635.74 Up Trend,
- (Intermediate-Term) 20 Day: 644.70 Up Trend,
- (Intermediate-Term) 55 Day: 614.73 Up Trend,
- (Long-Term) 100 Day: 597.81 Up Trend,
- (Long-Term) 200 Day: 589.13 Up Trend.
Additional Metrics
Overall Rating
- Short-Term: Bullish,
- Intermediate-Term: Bullish,
- Long-Term: Bullish.
Key Insights Summary
The SPY daily chart shows a strong and persistent uptrend across all timeframes, with price action making new highs and all benchmark moving averages trending upward. The most recent swing pivot is a high at 662.26, with the next potential pivot low at 635.74, indicating a healthy distance to the nearest support. Resistance levels are being tested and surpassed, while support levels remain well below current price, suggesting trend continuation rather than imminent reversal. ATR and volume metrics are stable, reflecting controlled volatility and steady participation. The neutral bias on the session fib grids suggests the market is not overextended, and the absence of major pullbacks or breakdowns points to a market in a trending phase rather than consolidation or distribution. For a futures swing trader, the environment is characterized by higher highs, higher lows, and strong momentum, favoring trend-following strategies and monitoring for any signs of exhaustion or reversal at key resistance levels.
Chart Analysis ATS AI Generated: 2025-09-19 07:16 for Informational use only, not trading advice. Terms and Risk Disclosure Copyright © 2025. Algo Trading Systems LLC.
