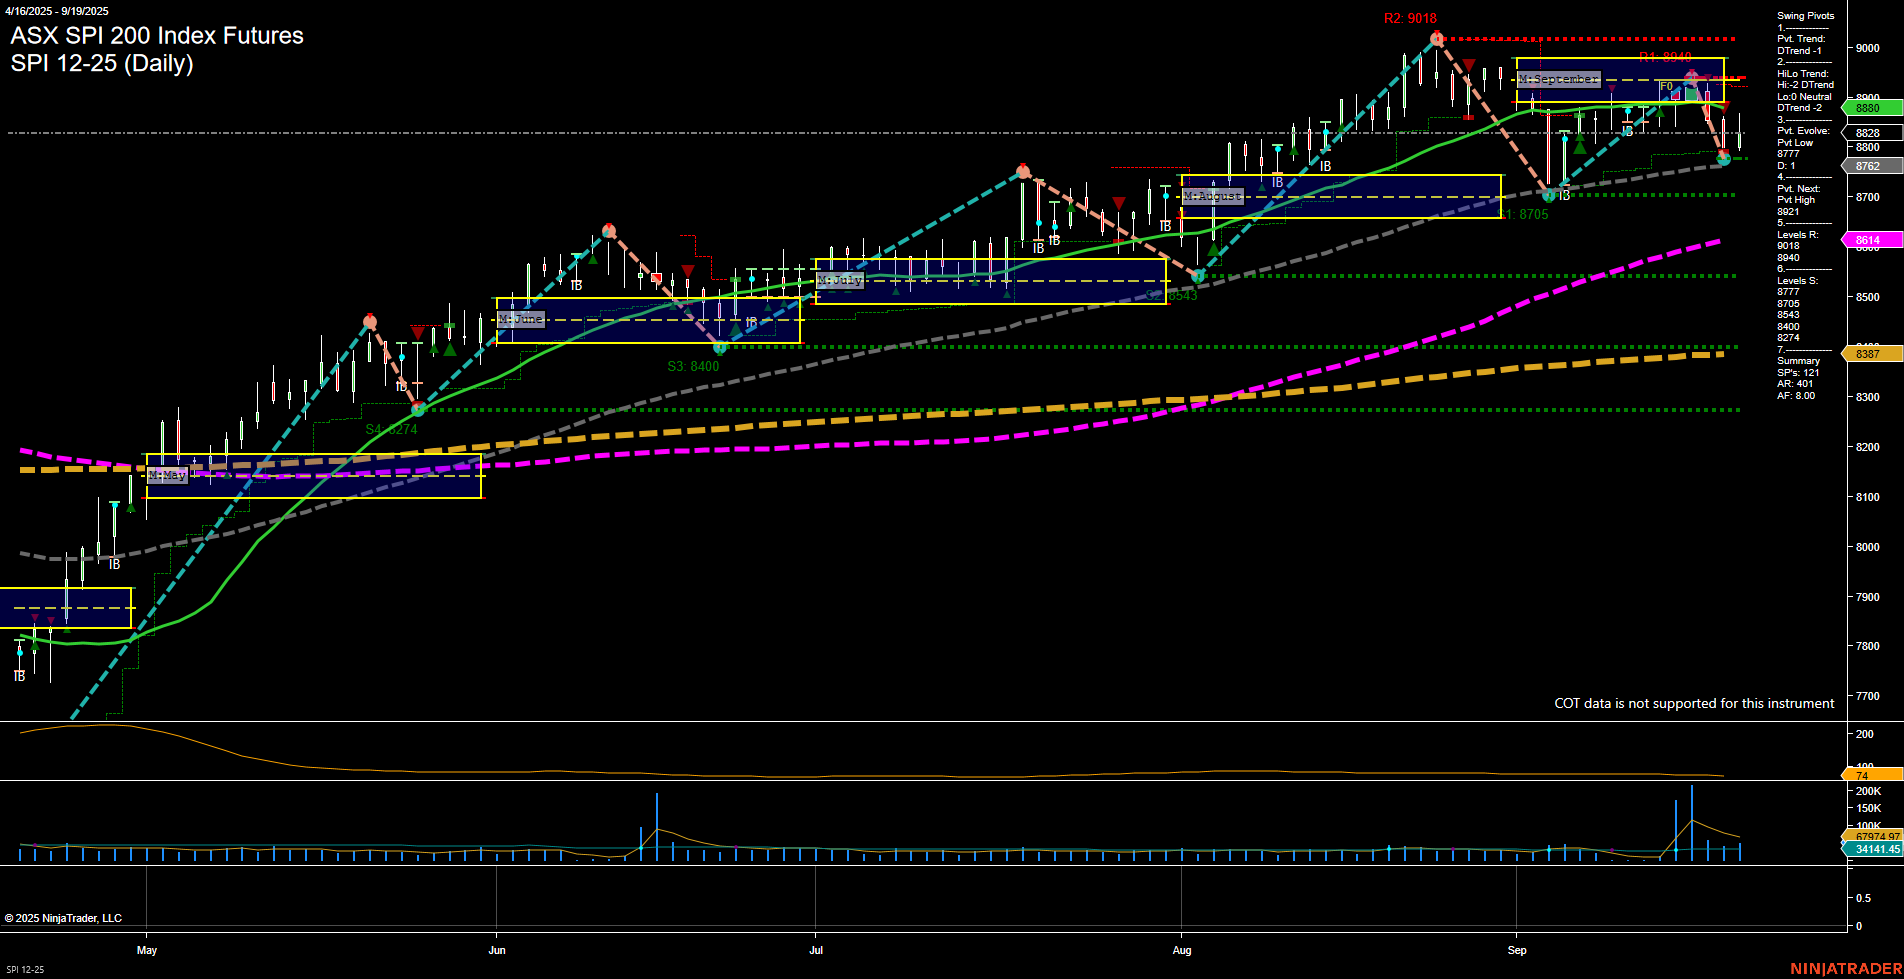
SPI ASX SPI 200 Index Futures Daily Chart Analysis: 2025-Sep-19 07:15 CT
Price Action
- Last: 8820,
- Bars: Medium,
- Mom: Momentum slow.
WSFG Weekly
- Short-Term
- WSFG Current: NA%
- F0%/NTZ' Bias: Price Neutral,
- WSFG Trend: Neutral.
MSFG Month Sep
- Intermediate-Term
- MSFG Current: NA%
- F0%/NTZ' Bias: Price Neutral,
- MSFG Trend: Neutral.
YSFG Year 2025
- Long-Term
- YSFG Current: NA%
- F0%/NTZ' Bias: Price Neutral,
- YSFG Trend: Neutral.
Swing Pivots
- (Short-Term) 1. Pvt. Trend: DTrend,
- (Intermediate-Term) 2. HiLo Trend: DTrend,
- 3. Pvt. Evolve: Pvt Low 8715,
- 4. Pvt. Next: Pvt High 8921,
- 5. Levels R: 9018, 8921, 8849,
- 6. Levels S: 8715, 8705, 8400, 8274.
Daily Benchmarks
- (Short-Term) 5 Day: 8880 Down Trend,
- (Short-Term) 10 Day: 8876 Down Trend,
- (Intermediate-Term) 20 Day: 8849 Down Trend,
- (Intermediate-Term) 55 Day: 8614 Up Trend,
- (Long-Term) 100 Day: 8387 Up Trend,
- (Long-Term) 200 Day: 8040 Up Trend.
Additional Metrics
Overall Rating
- Short-Term: Bearish,
- Intermediate-Term: Bearish,
- Long-Term: Bullish.
Key Insights Summary
The SPI 200 Index Futures daily chart shows a recent shift in momentum, with price action turning lower from the September highs. Both short-term and intermediate-term swing pivot trends are now in a downtrend, confirmed by the most recent pivot low at 8715 and a series of lower highs. The 5, 10, and 20-day moving averages have all turned down, reinforcing the short-term bearish tone, while the 55, 100, and 200-day moving averages remain in uptrends, indicating that the broader long-term structure is still bullish. Volatility, as measured by ATR, is moderate, and volume remains steady. The market is currently consolidating just above key support at 8715, with resistance levels overhead at 8849, 8921, and the recent high at 9018. The overall setup suggests a corrective phase within a larger uptrend, with the potential for further downside in the short to intermediate term unless support holds and momentum shifts. No clear breakout or reversal signals are present, and the market is in a wait-and-see mode as it tests support levels.
Chart Analysis ATS AI Generated: 2025-09-19 07:16 for Informational use only, not trading advice. Terms and Risk Disclosure Copyright © 2025. Algo Trading Systems LLC.
