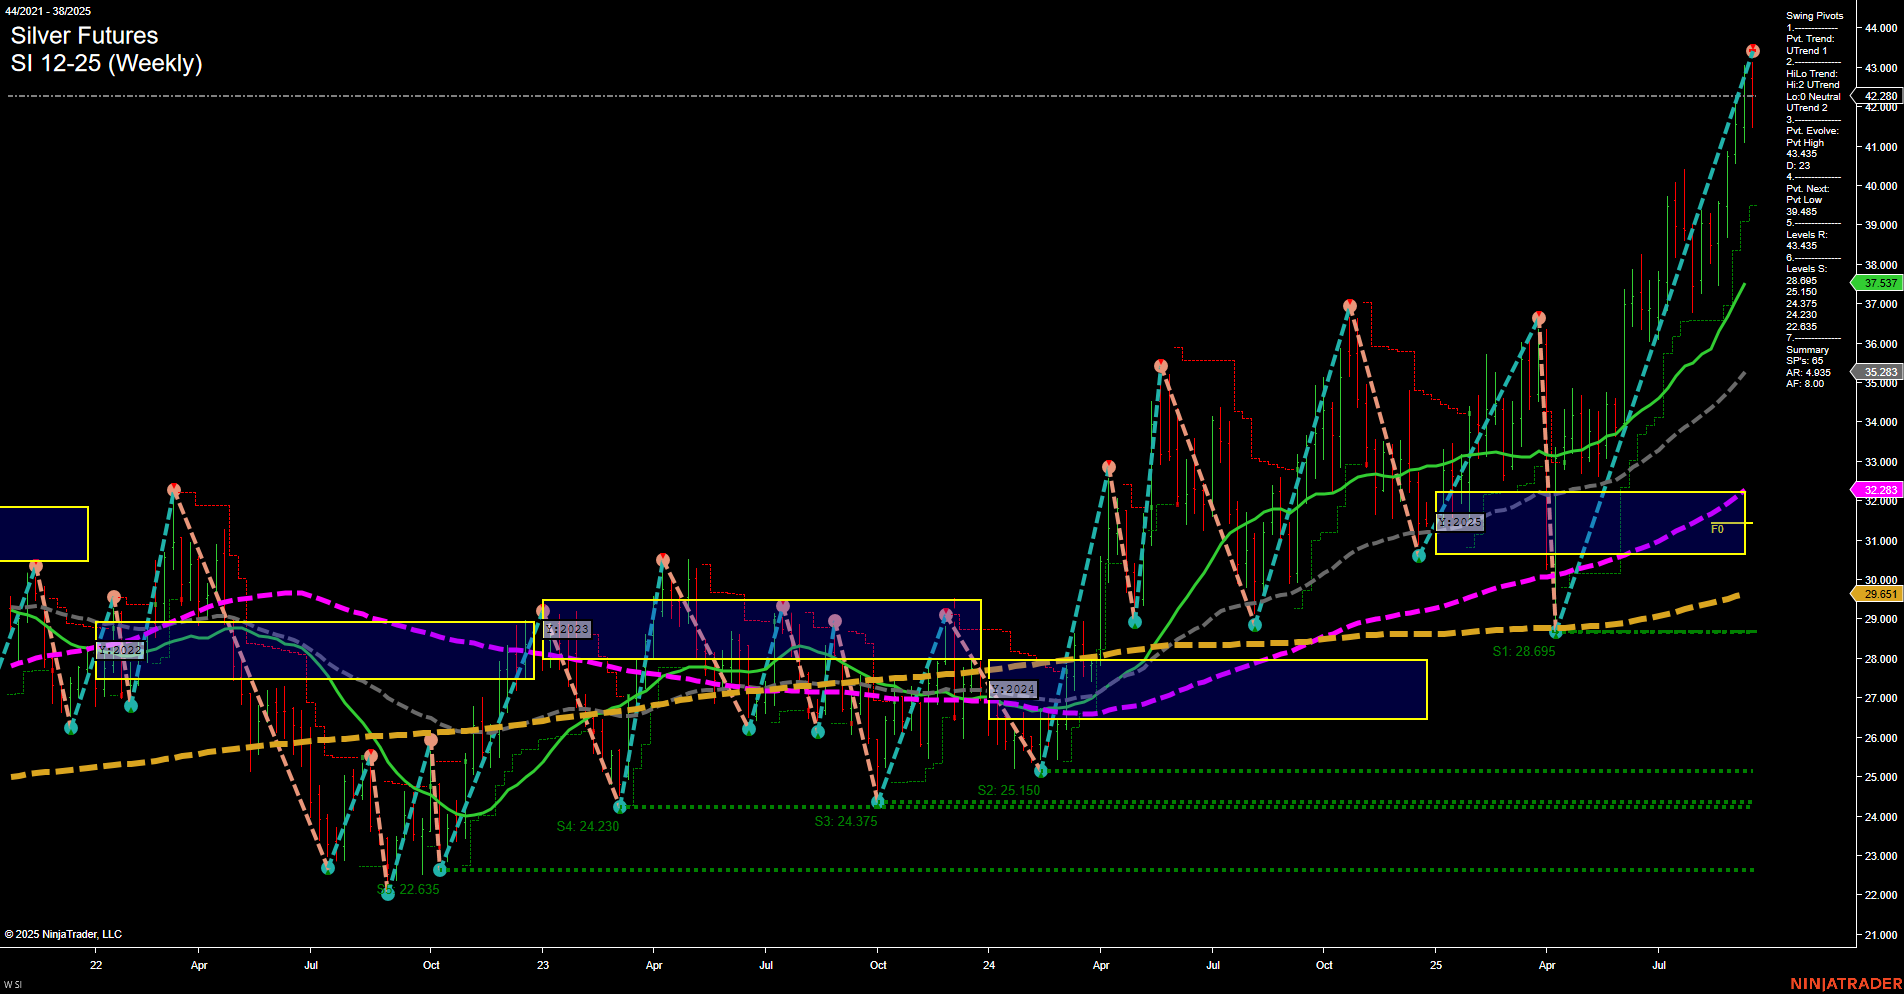
SI Silver Futures Weekly Chart Analysis: 2025-Sep-19 07:15 CT
Price Action
- Last: 43.435,
- Bars: Large,
- Mom: Momentum fast.
WSFG Weekly
- Short-Term
- WSFG Current: -21%
- F0%/NTZ' Bias: Price Below,
- WSFG Trend: Down.
MSFG Month Sep
- Intermediate-Term
- MSFG Current: 27%
- F0%/NTZ' Bias: Price Above,
- MSFG Trend: Up.
YSFG Year 2025
- Long-Term
- YSFG Current: 138%
- F0%/NTZ' Bias: Price Above,
- YSFG Trend: Up.
Swing Pivots
- (Short-Term) 1. Pvt. Trend: UTrend,
- (Intermediate-Term) 2. HiLo Trend: Neutral,
- 3. Pvt. Evolve: Pvt high 43.435,
- 4. Pvt. Next: Pvt low 39.485,
- 5. Levels R: 43.435, 41.000, 40.485, 39.485,
- 6. Levels S: 37.537, 36.000, 35.283, 35.000, 32.783, 29.651, 28.695, 25.150, 24.375, 24.230, 22.635.
Weekly Benchmarks
- (Intermediate-Term) 5 Week: 41.000 Up Trend,
- (Intermediate-Term) 10 Week: 40.485 Up Trend,
- (Long-Term) 20 Week: 37.537 Up Trend,
- (Long-Term) 55 Week: 32.783 Up Trend,
- (Long-Term) 100 Week: 29.651 Up Trend,
- (Long-Term) 200 Week: 28.695 Up Trend.
Recent Trade Signals
- 17 Sep 2025: Short SI 12-25 @ 42.385 Signals.USAR-WSFG
- 17 Sep 2025: Short SI 12-25 @ 42.405 Signals.USAR.TR120
- 11 Sep 2025: Long SI 12-25 @ 42.045 Signals.USAR-MSFG
Overall Rating
- Short-Term: Neutral,
- Intermediate-Term: Bullish,
- Long-Term: Bullish.
Key Insights Summary
Silver futures have surged to new highs, with the last price at 43.435 and large, fast-moving bars indicating strong momentum. Despite a short-term WSFG downtrend and recent short signals, the prevailing swing pivot trend remains up, and all key moving averages are trending higher, supporting a robust intermediate and long-term bullish structure. The intermediate-term MSFG and long-term YSFG both show price well above their respective NTZ/F0% levels, confirming the strength of the uptrend. However, the short-term picture is mixed, with a neutral rating due to the recent short signals and a WSFG downtrend, suggesting potential for a pullback or consolidation after the recent rally. Key resistance is at the recent high (43.435), while multiple support levels below (notably 41.000, 37.537, and 36.000) could serve as areas for price reaction. The overall technical landscape favors the bulls on higher timeframes, but short-term traders should be alert to possible retracements or volatility as the market digests recent gains.
Chart Analysis ATS AI Generated: 2025-09-19 07:15 for Informational use only, not trading advice. Terms and Risk Disclosure Copyright © 2025. Algo Trading Systems LLC.
