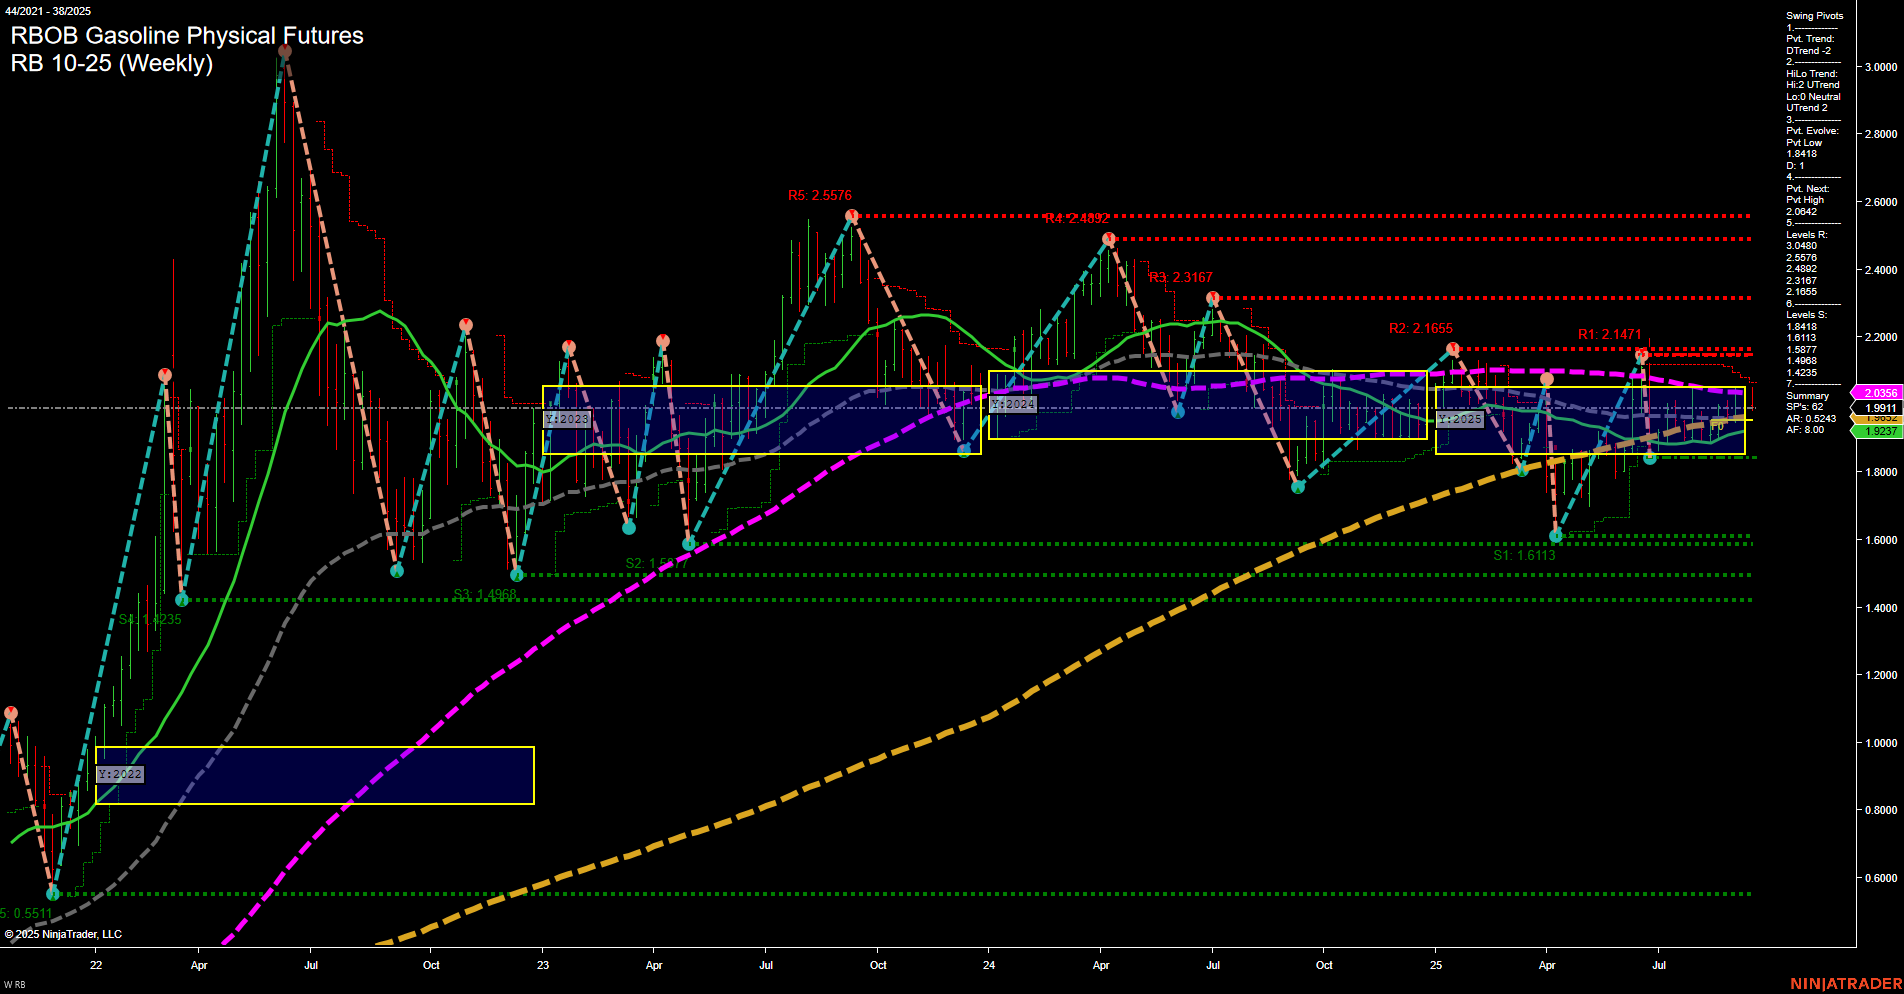
RB RBOB Gasoline Physical Futures Weekly Chart Analysis: 2025-Sep-19 07:14 CT
Price Action
- Last: 1.9911,
- Bars: Medium,
- Mom: Momentum slow.
WSFG Weekly
- Short-Term
- WSFG Current: -5%
- F0%/NTZ' Bias: Price Below,
- WSFG Trend: Down.
MSFG Month Sep
- Intermediate-Term
- MSFG Current: 16%
- F0%/NTZ' Bias: Price Above,
- MSFG Trend: Up.
YSFG Year 2025
- Long-Term
- YSFG Current: 4%
- F0%/NTZ' Bias: Price Above,
- YSFG Trend: Up.
Swing Pivots
- (Short-Term) 1. Pvt. Trend: DTrend,
- (Intermediate-Term) 2. HiLo Trend: UTrend,
- 3. Pvt. Evolve: Pvt Low 1.8418,
- 4. Pvt. Next: Pvt High 2.0442,
- 5. Levels R: 2.5576, 2.4892, 2.3167, 2.2147, 2.1655,
- 6. Levels S: 1.8418, 1.6113, 1.4988, 1.4235.
Weekly Benchmarks
- (Intermediate-Term) 5 Week: 1.9931 Up Trend,
- (Intermediate-Term) 10 Week: 1.9327 Up Trend,
- (Long-Term) 20 Week: 2.0356 Down Trend,
- (Long-Term) 55 Week: 1.9911 Up Trend,
- (Long-Term) 100 Week: 1.9237 Up Trend,
- (Long-Term) 200 Week: 1.5511 Up Trend.
Recent Trade Signals
- 16 Sep 2025: Long RB 10-25 @ 2.0105 Signals.USAR-WSFG
- 15 Sep 2025: Long RB 10-25 @ 1.9964 Signals.USAR-MSFG
- 12 Sep 2025: Long RB 10-25 @ 2.0066 Signals.USAR.TR120
Overall Rating
- Short-Term: Neutral,
- Intermediate-Term: Bullish,
- Long-Term: Bullish.
Key Insights Summary
The RBOB Gasoline futures market is currently showing a mixed technical landscape. Price action is consolidating with medium-sized bars and slow momentum, indicating a lack of strong directional conviction in the short term. The Weekly Session Fib Grid (WSFG) trend is down, with price below the NTZ center, reflecting short-term weakness. However, both the Monthly (MSFG) and Yearly (YSFG) Session Fib Grids are trending up, with price above their respective NTZ centers, suggesting underlying intermediate and long-term strength.
Swing pivot analysis highlights a short-term downtrend but an intermediate-term uptrend, with the next key pivot high at 2.0442 and support at 1.8418. Resistance levels are clustered above 2.16, while support is well-defined below 1.85. The moving averages reinforce the bullish intermediate and long-term outlook, with most benchmarks trending up except for the 20-week MA, which is slightly down.
Recent trade signals have all been to the long side, aligning with the bullish intermediate and long-term trends. Overall, the market is in a consolidation phase short-term, but the broader structure favors a bullish bias as long as key support levels hold and the uptrend in higher timeframes persists.
Chart Analysis ATS AI Generated: 2025-09-19 07:14 for Informational use only, not trading advice. Terms and Risk Disclosure Copyright © 2025. Algo Trading Systems LLC.
