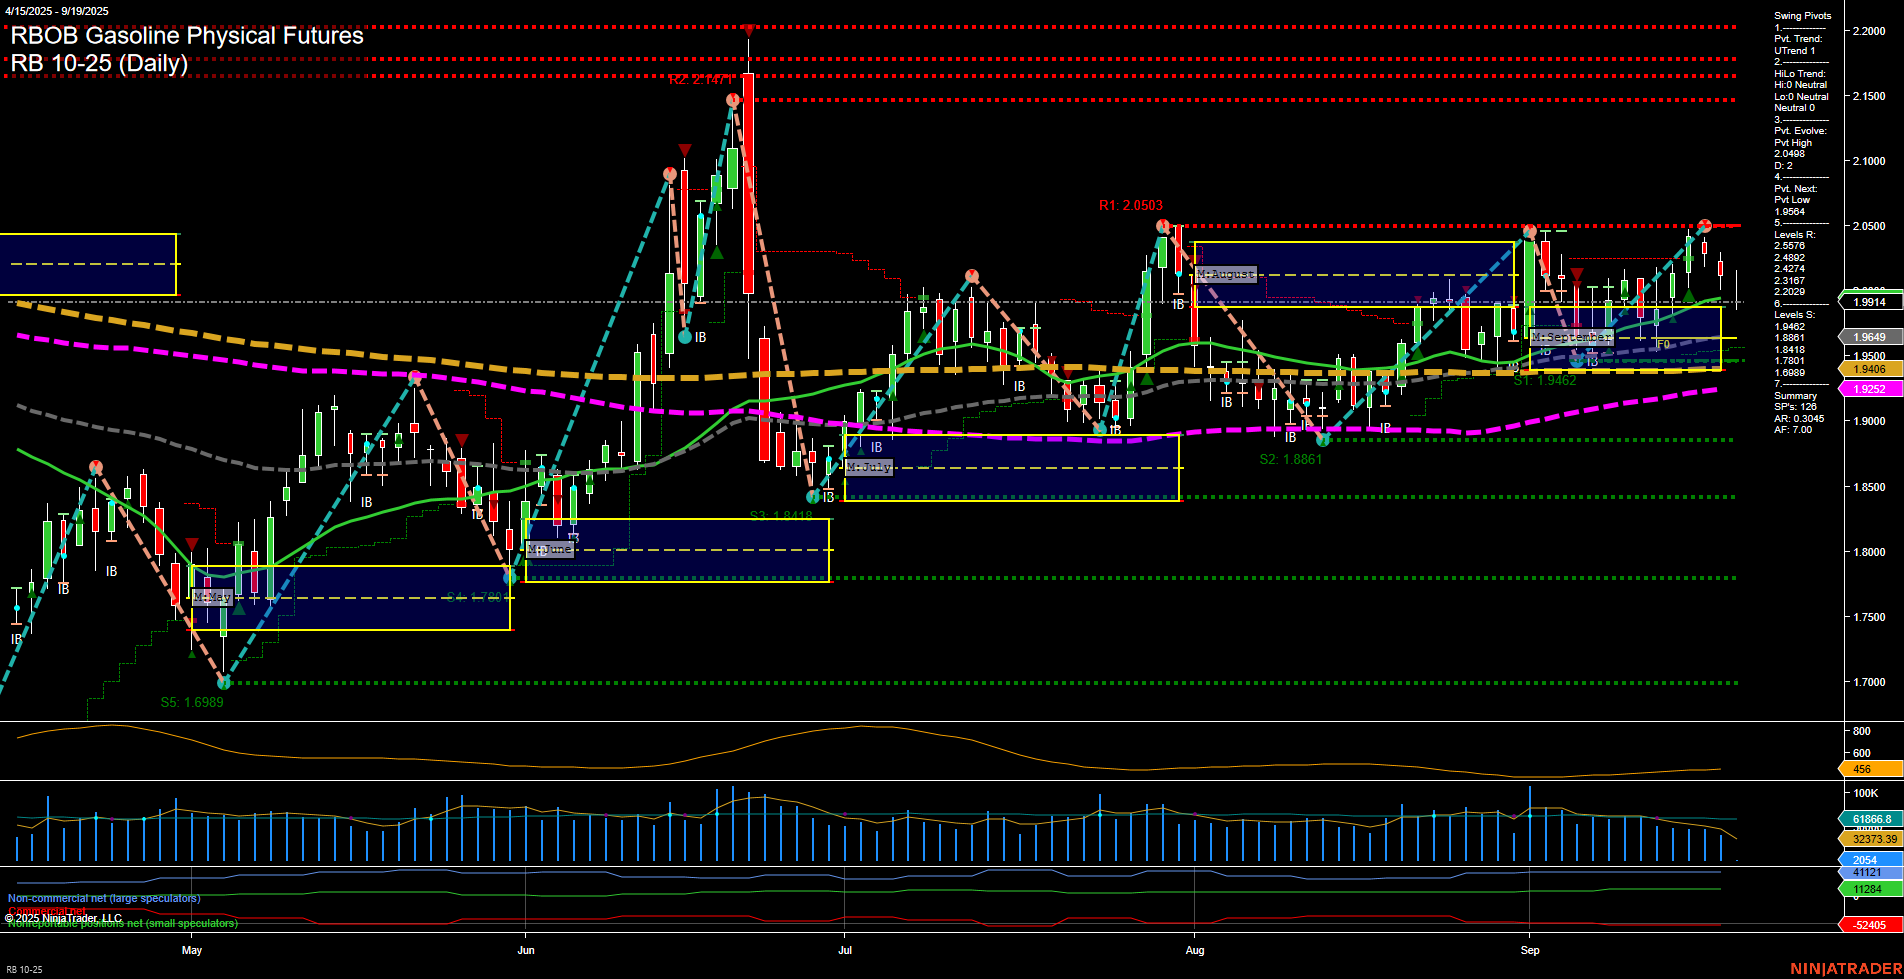
RB RBOB Gasoline Physical Futures Daily Chart Analysis: 2025-Sep-19 07:13 CT
Price Action
- Last: 1.9914,
- Bars: Medium,
- Mom: Momentum average.
WSFG Weekly
- Short-Term
- WSFG Current: -5%
- F0%/NTZ' Bias: Price Below,
- WSFG Trend: Down.
MSFG Month Sep
- Intermediate-Term
- MSFG Current: 16%
- F0%/NTZ' Bias: Price Above,
- MSFG Trend: Up.
YSFG Year 2025
- Long-Term
- YSFG Current: 4%
- F0%/NTZ' Bias: Price Above,
- YSFG Trend: Up.
Swing Pivots
- (Short-Term) 1. Pvt. Trend: UTrend,
- (Intermediate-Term) 2. HiLo Trend: DTrend,
- 3. Pvt. Evolve: Pvt High 2.0482,
- 4. Pvt. Next: Pvt Low 1.9564,
- 5. Levels R: 2.0576, 2.0482, 2.0467, 2.0317, 2.0222,
- 6. Levels S: 1.9462, 1.8861, 1.8418, 1.6989.
Daily Benchmarks
- (Short-Term) 5 Day: 1.9946 Up Trend,
- (Short-Term) 10 Day: 1.9649 Up Trend,
- (Intermediate-Term) 20 Day: 1.9600 Up Trend,
- (Intermediate-Term) 55 Day: 1.9292 Up Trend,
- (Long-Term) 100 Day: 1.9295 Up Trend,
- (Long-Term) 200 Day: 1.9925 Up Trend.
Additional Metrics
Recent Trade Signals
- 16 Sep 2025: Long RB 10-25 @ 2.0105 Signals.USAR-WSFG
- 15 Sep 2025: Long RB 10-25 @ 1.9964 Signals.USAR-MSFG
- 12 Sep 2025: Long RB 10-25 @ 2.0066 Signals.USAR.TR120
Overall Rating
- Short-Term: Bullish,
- Intermediate-Term: Neutral,
- Long-Term: Bullish.
Key Insights Summary
The RBOB Gasoline futures market is currently showing a mixed but constructive technical structure. Price action is holding above key monthly and yearly session fib grid levels, with the last price just below the 5-day and 200-day moving averages, both of which are in uptrends. Short-term momentum is average, and recent bars are of medium size, indicating a steady but not explosive environment. The short-term swing pivot trend is up, but the intermediate-term HiLo trend is down, suggesting some consolidation or a possible transition phase. Resistance is clustered in the 2.02–2.06 range, while support is well-defined at 1.95 and lower. All major moving averages are trending higher, supporting a bullish long-term outlook. Recent trade signals have favored the long side, aligning with the prevailing uptrend in benchmarks. Volatility (ATR) and volume (VOLMA) are moderate, reflecting a market that is active but not overheated. Overall, the market is in a bullish posture for both short- and long-term horizons, while the intermediate-term remains neutral as price digests recent gains and tests resistance. The technical setup suggests the market is in a consolidation phase within a broader uptrend, with potential for further upside if resistance levels are cleared.
Chart Analysis ATS AI Generated: 2025-09-19 07:14 for Informational use only, not trading advice. Terms and Risk Disclosure Copyright © 2025. Algo Trading Systems LLC.
