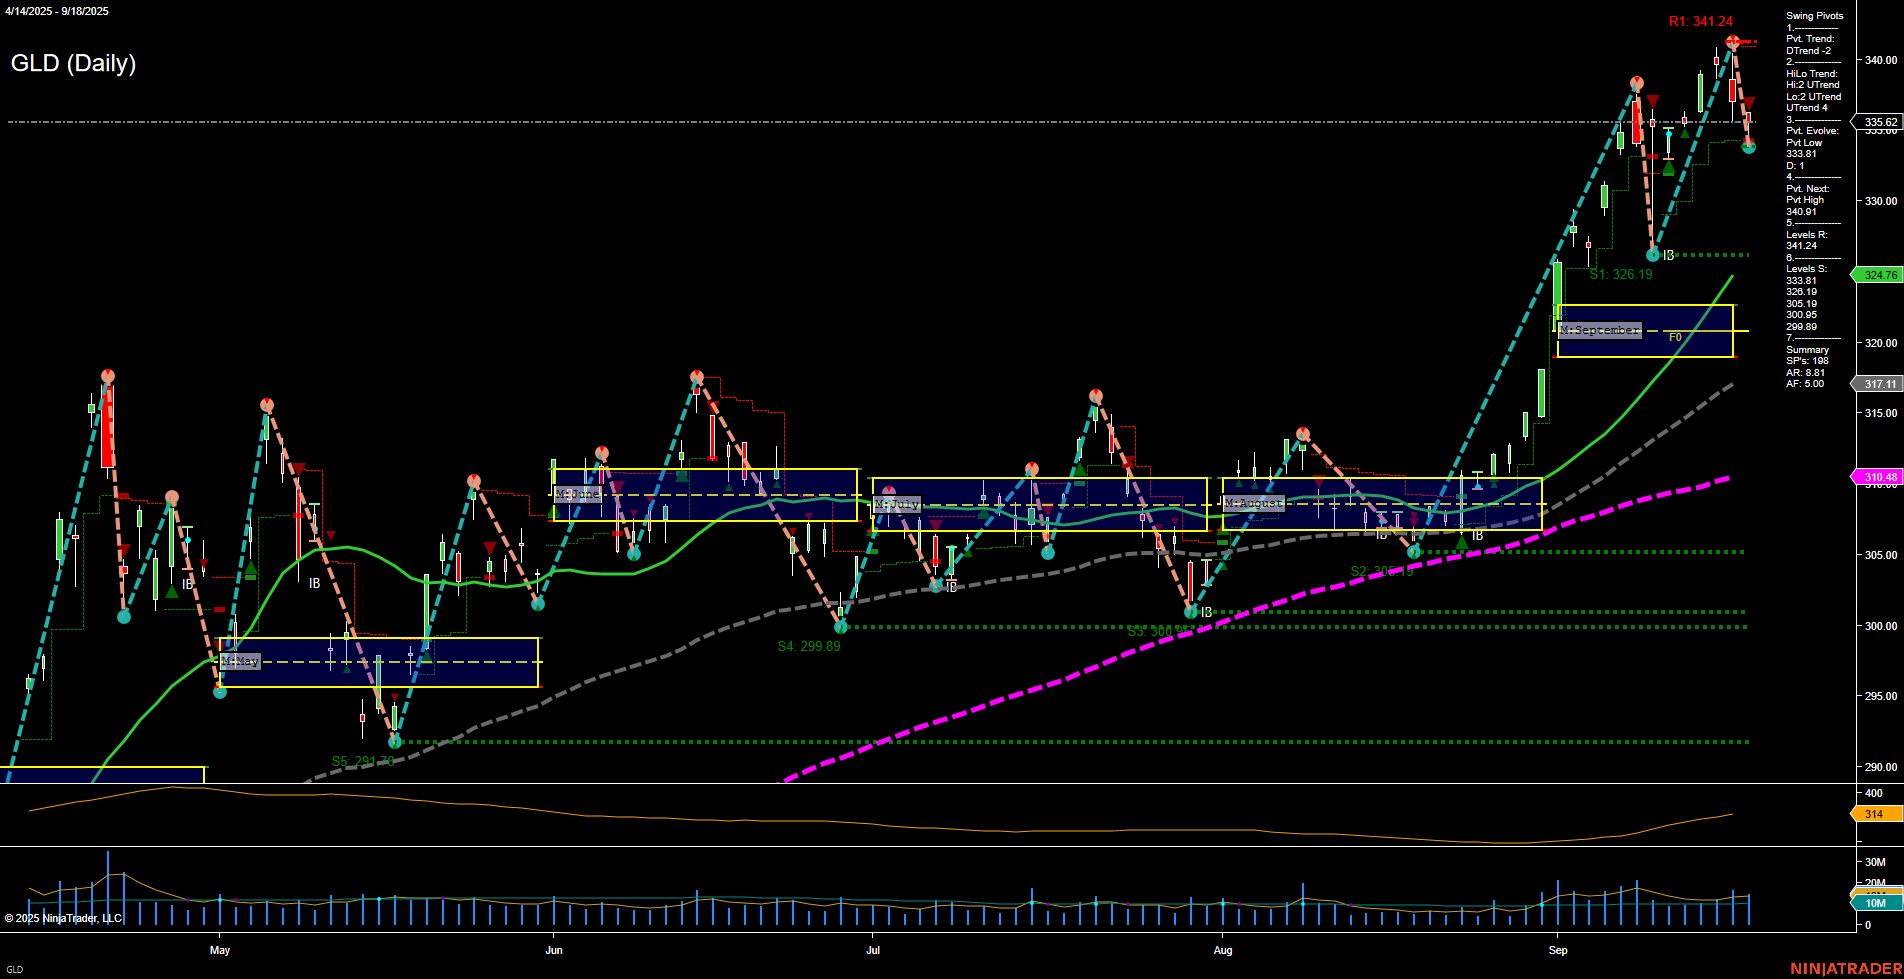
GLD SPDR Gold Shares Daily Chart Analysis: 2025-Sep-19 07:10 CT
Price Action
- Last: 335.62,
- Bars: Large,
- Mom: Momentum fast.
WSFG Weekly
- Short-Term
- WSFG Current: NA%
- F0%/NTZ' Bias: Price Neutral,
- WSFG Trend: Neutral.
MSFG Month Sep
- Intermediate-Term
- MSFG Current: NA%
- F0%/NTZ' Bias: Price Neutral,
- MSFG Trend: Neutral.
YSFG Year 2025
- Long-Term
- YSFG Current: NA%
- F0%/NTZ' Bias: Price Neutral,
- YSFG Trend: Neutral.
Swing Pivots
- (Short-Term) 1. Pvt. Trend: DTrend,
- (Intermediate-Term) 2. HiLo Trend: UTrend,
- 3. Pvt. Evolve: Pvt High 341.24,
- 4. Pvt. Next: Pvt Low 326.19,
- 5. Levels R: 341.24,
- 6. Levels S: 326.19, 318.61, 305.19, 300.18, 299.89, 294.26.
Daily Benchmarks
- (Short-Term) 5 Day: 335.81 Up Trend,
- (Short-Term) 10 Day: 332.81 Up Trend,
- (Intermediate-Term) 20 Day: 324.76 Up Trend,
- (Intermediate-Term) 55 Day: 317.11 Up Trend,
- (Long-Term) 100 Day: 310.48 Up Trend,
- (Long-Term) 200 Day: 299.89 Up Trend.
Additional Metrics
Overall Rating
- Short-Term: Neutral,
- Intermediate-Term: Bullish,
- Long-Term: Bullish.
Key Insights Summary
GLD has recently experienced a strong upside breakout, evidenced by large bars and fast momentum, pushing price to new swing highs. However, the short-term swing pivot trend has shifted to a DTrend (downtrend), indicating a potential short-term pullback or consolidation after the recent rally. Intermediate and long-term trends remain firmly bullish, supported by all benchmark moving averages trending upward and price well above key support levels. The ATR is elevated, reflecting increased volatility, while volume remains robust. The market is currently digesting gains after a sharp move, with the next key support at 326.19 and major resistance at the recent high of 341.24. The overall structure suggests a strong bullish bias on higher timeframes, with short-term traders watching for either a continuation after consolidation or a deeper retracement toward support.
Chart Analysis ATS AI Generated: 2025-09-19 07:11 for Informational use only, not trading advice. Terms and Risk Disclosure Copyright © 2025. Algo Trading Systems LLC.
