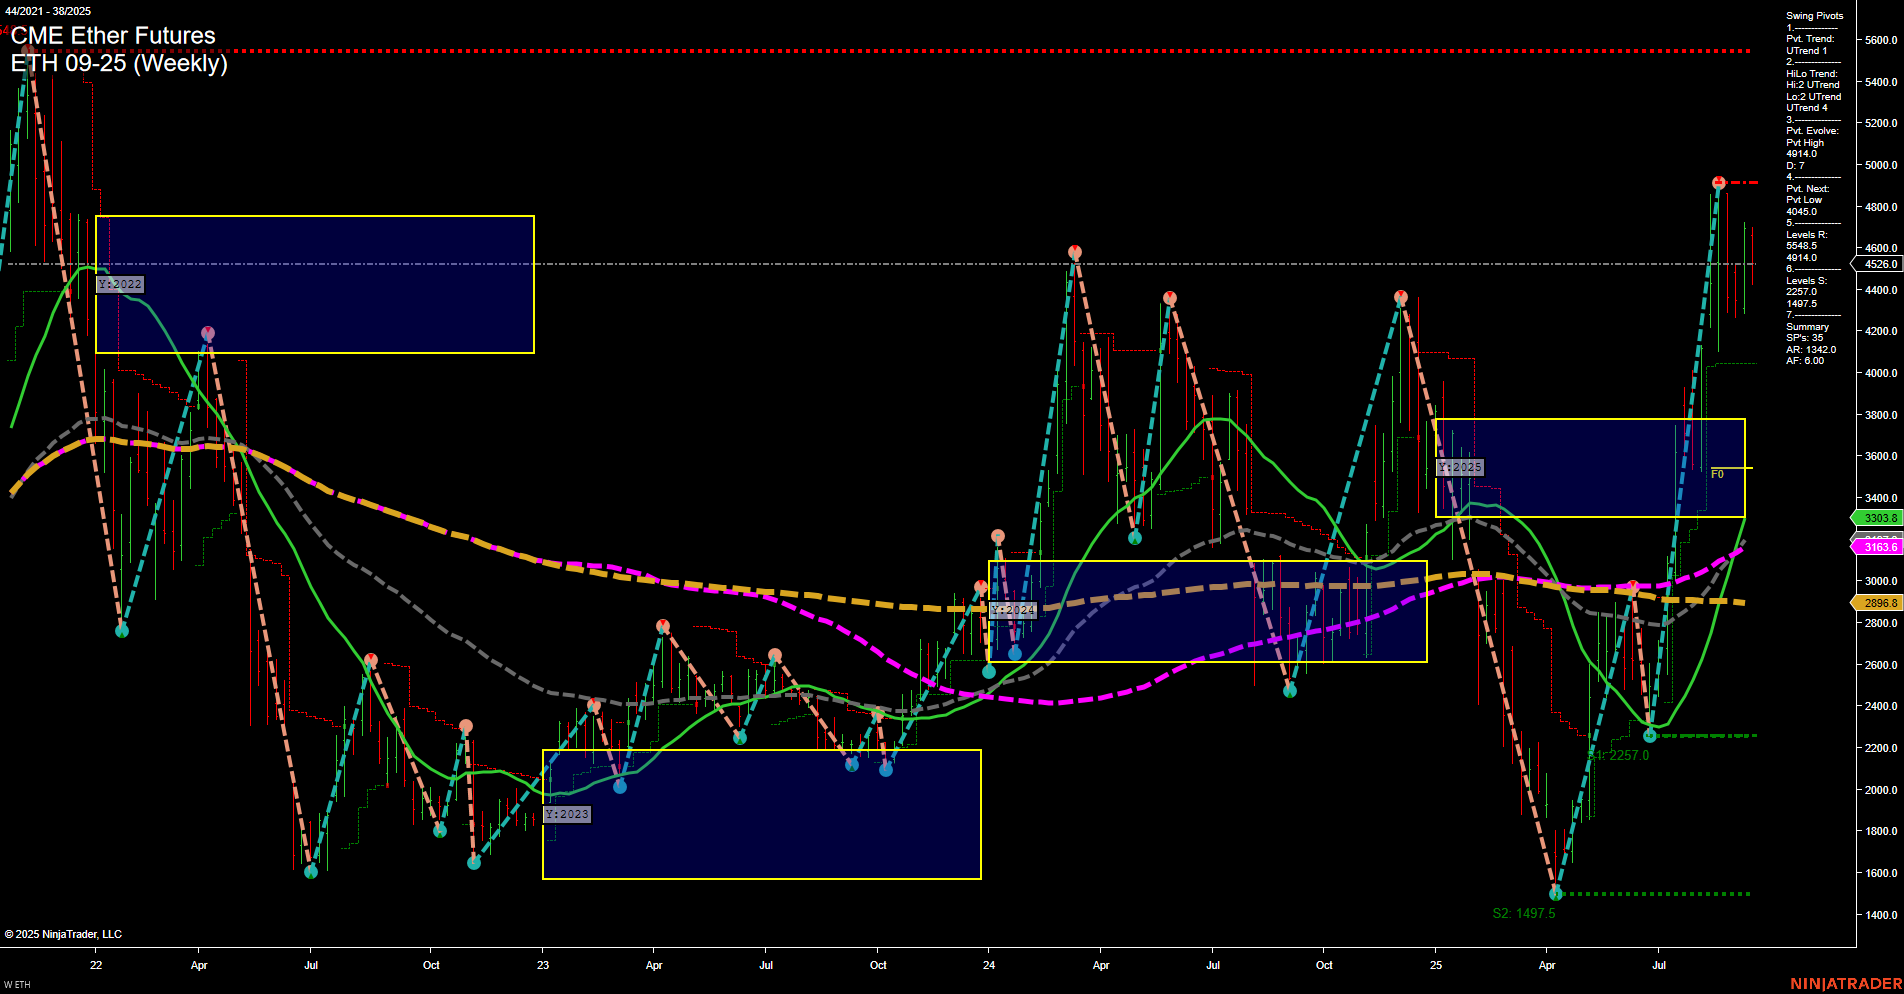
The ETH CME Ether Futures weekly chart shows a market in transition. Price action is strong with large bars and fast momentum, indicating heightened volatility and active participation. The short-term WSFG trend is down, with price currently below the NTZ center, suggesting a recent pullback or correction phase. However, both the intermediate-term (MSFG) and long-term (YSFG) trends remain up, with price above their respective NTZ centers, reflecting underlying bullish structure. Swing pivots confirm this mixed environment: the short-term pivot trend is up, and the intermediate-term HiLo trend is also up, with the most recent pivot high at 4614.0 acting as resistance and the next significant support at 2257.0. All benchmark moving averages from 5-week to 200-week are trending upward, reinforcing the broader bullish bias. Recent trade signals highlight both long and short activity, reflecting the choppy, two-way action typical of a market digesting gains after a strong rally. The overall rating is neutral short-term due to the WSFG downtrend and mixed signals, but bullish for both intermediate and long-term horizons as the uptrends remain intact. This environment is characterized by volatility, potential for sharp retracements, and ongoing trend evolution, with key levels to watch for breakout or reversal confirmation.