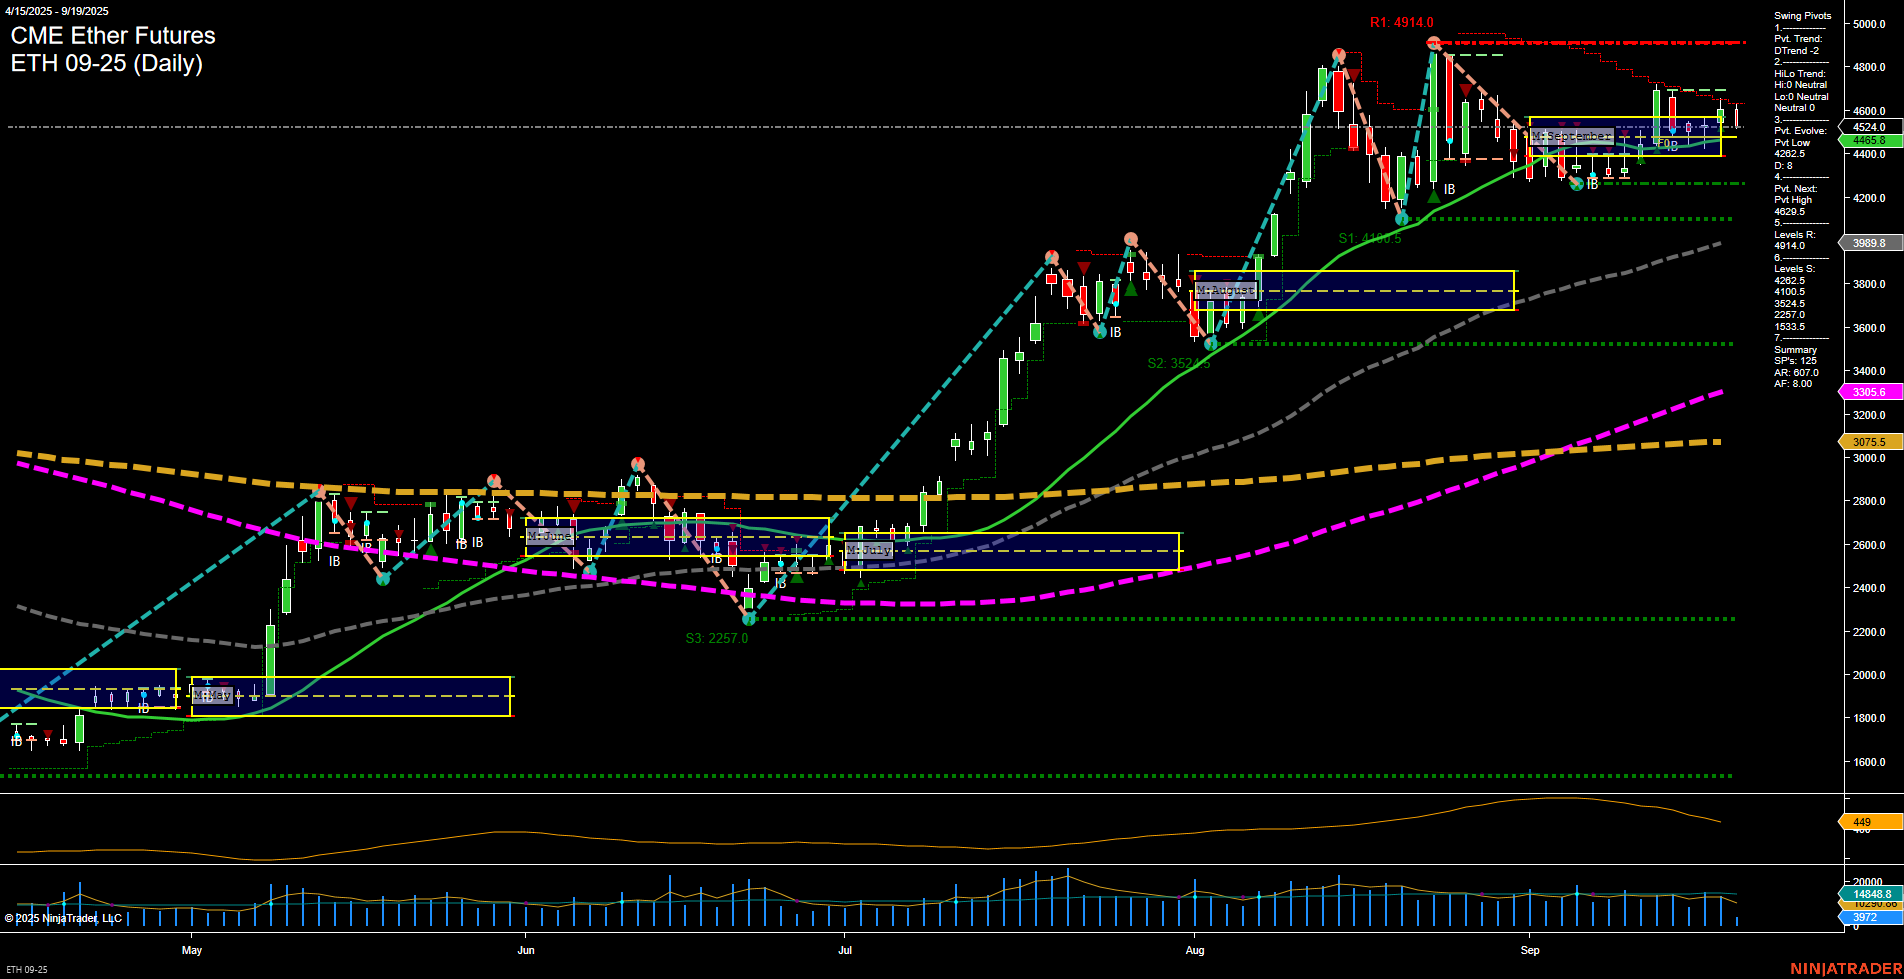
The current daily chart for ETH CME Ether Futures shows a market in transition. Short-term momentum is slow, with price action consolidating near the lower end of the recent range and the last bar closing at 4544.5. The weekly session fib grid (WSFG) trend is down, with price below the NTZ, indicating short-term bearishness. This is reinforced by the swing pivot trend (DTrend) and all short-term moving averages (5, 10, 20 day) trending down. However, the intermediate-term (monthly session fib grid, MSFG) remains up, with price above the NTZ and the 55-day moving average still in an uptrend, suggesting underlying support. The long-term outlook is bullish, as both the yearly session fib grid and long-term moving averages (100, 200 day) are trending up, reflecting a broader uptrend. Resistance is clustered at 4622.5, 4801.0, and 4914.0, while support is at 4465.5 and much lower at 3524.5. Recent trade signals show mixed direction, with a short signal following two long entries, highlighting the choppy and indecisive nature of the current market. Volatility (ATR) is moderate, and volume remains steady. Overall, the market is consolidating after a strong rally, with short-term weakness but intermediate and long-term strength still intact. Swing traders should note the potential for further consolidation or a test of support before any renewed trend continuation.