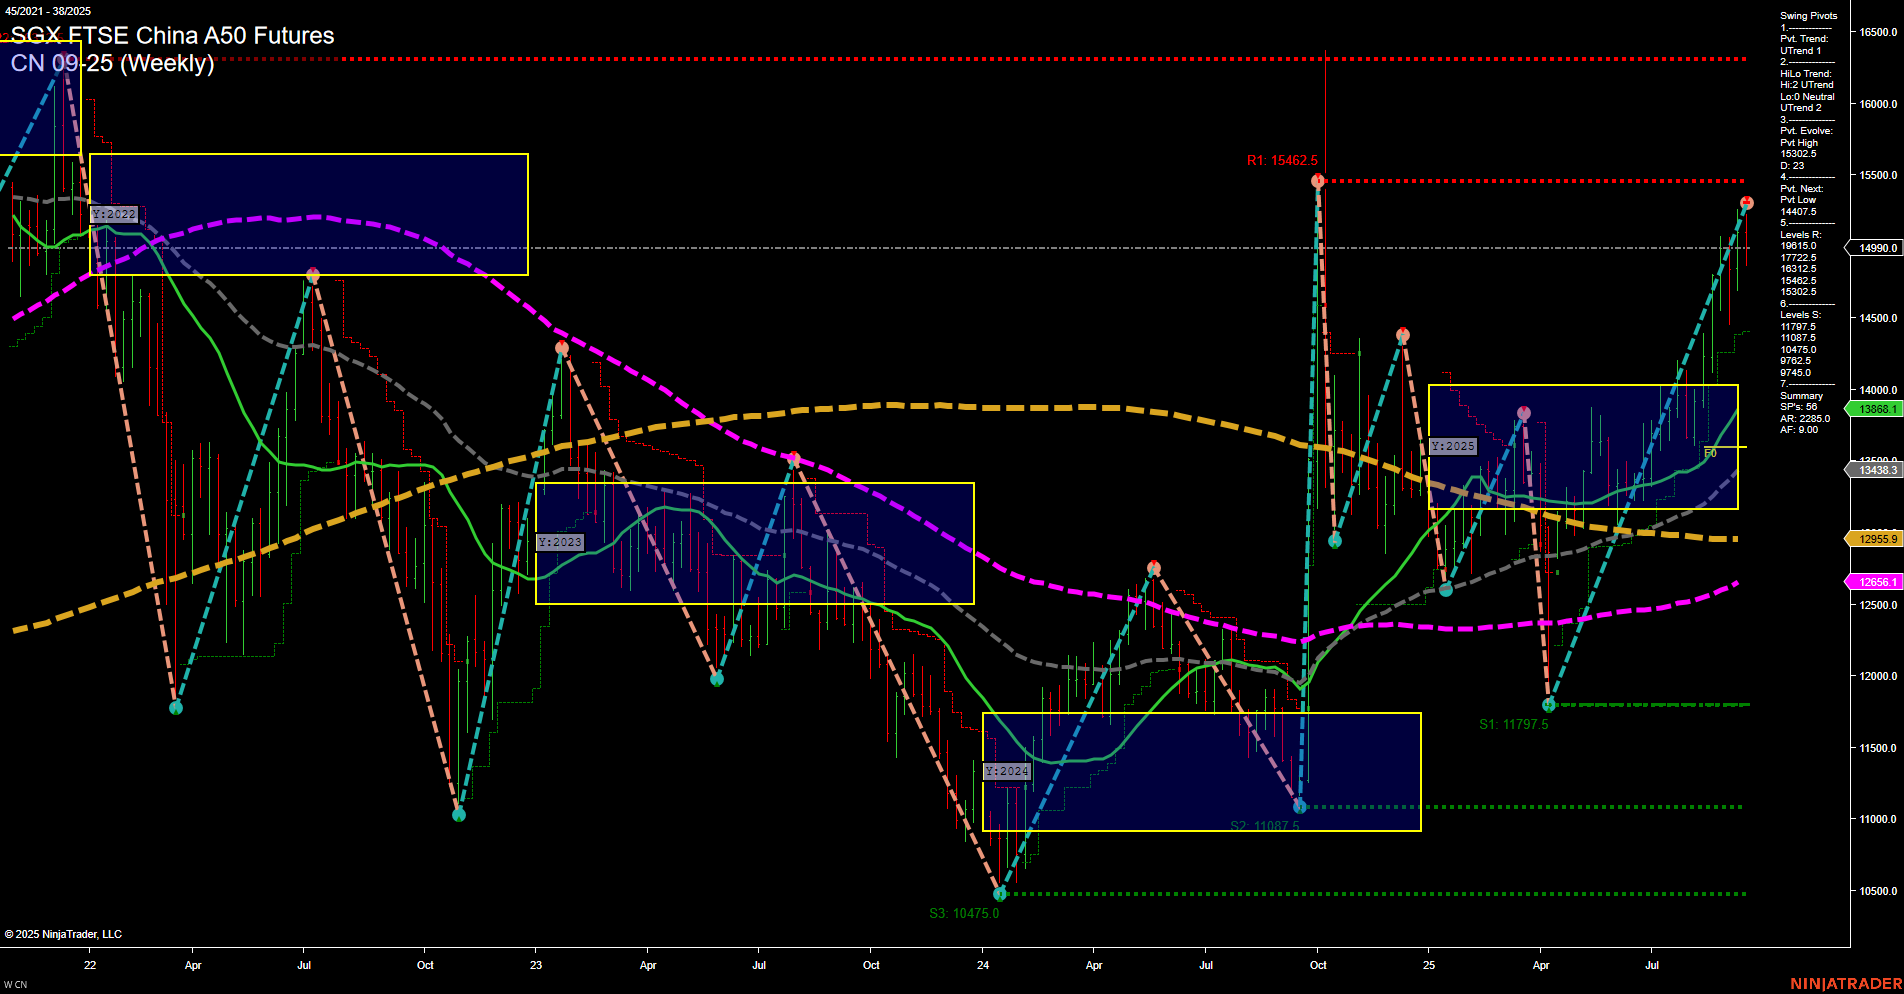
CN SGX FTSE China A50 Futures Weekly Chart Analysis: 2025-Sep-19 07:06 CT
Price Action
- Last: 14990.0,
- Bars: Large,
- Mom: Momentum fast.
WSFG Weekly
- Short-Term
- WSFG Current: NA%
- F0%/NTZ' Bias: Price Neutral,
- WSFG Trend: Neutral.
MSFG Month Sep
- Intermediate-Term
- MSFG Current: NA%
- F0%/NTZ' Bias: Price Neutral,
- MSFG Trend: Neutral.
YSFG Year 2025
- Long-Term
- YSFG Current: NA%
- F0%/NTZ' Bias: Price Neutral,
- YSFG Trend: Neutral.
Swing Pivots
- (Short-Term) 1. Pvt. Trend: UTrend,
- (Intermediate-Term) 2. HiLo Trend: UTrend,
- 3. Pvt. Evolve: Pvt high 14990.0,
- 4. Pvt. Next: Pvt low 13886.1,
- 5. Levels R: 15462.5, 14990.0,
- 6. Levels S: 13886.1, 13433.8, 12955.5, 12566.1, 11797.5, 11087.5, 10475.0.
Weekly Benchmarks
- (Intermediate-Term) 5 Week: 13886.1 Up Trend,
- (Intermediate-Term) 10 Week: 13433.8 Up Trend,
- (Long-Term) 20 Week: 12955.5 Up Trend,
- (Long-Term) 55 Week: 12566.1 Up Trend,
- (Long-Term) 100 Week: 12566.1 Down Trend,
- (Long-Term) 200 Week: 12955.5 Down Trend.
Overall Rating
- Short-Term: Bullish,
- Intermediate-Term: Bullish,
- Long-Term: Neutral.
Key Insights Summary
The CN SGX FTSE China A50 Futures weekly chart shows a strong bullish momentum in the short and intermediate term, with price surging to a new swing high at 14990.0. Large weekly bars and fast momentum indicate aggressive buying interest, pushing price above key moving averages (5, 10, 20, 55 week), all of which are trending up. The swing pivot structure confirms an uptrend, with the next significant support at 13886.1 and resistance at 15462.5. However, the 100 and 200 week moving averages remain in a downtrend, suggesting that the long-term trend is still neutral and that the market is in a transitional phase. The price is currently within a neutral zone on the session fib grids, indicating a pause or consolidation could occur after the recent rally. Overall, the technical structure favors continued strength in the near term, but long-term confirmation is still pending as the market tests major resistance levels.
Chart Analysis ATS AI Generated: 2025-09-19 07:06 for Informational use only, not trading advice. Terms and Risk Disclosure Copyright © 2025. Algo Trading Systems LLC.
