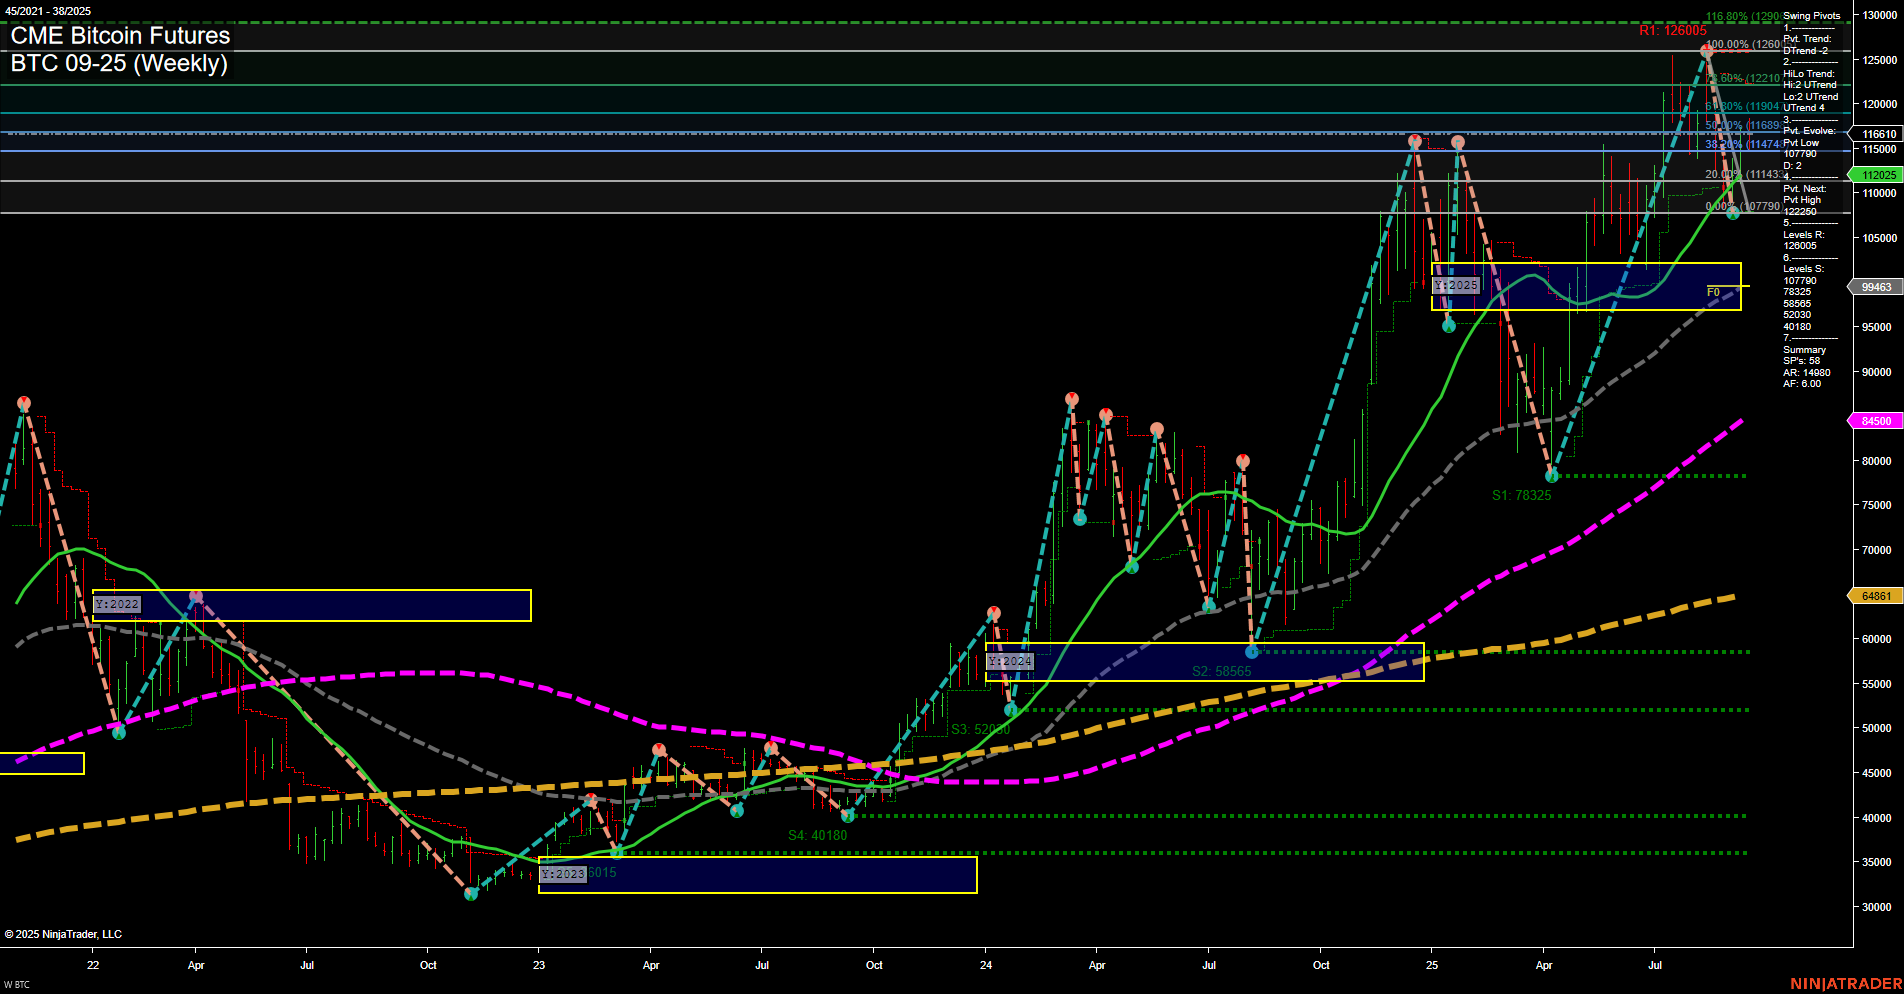
BTC CME Bitcoin Futures Weekly Chart Analysis: 2025-Sep-19 07:04 CT
Price Action
- Last: 112205,
- Bars: Large,
- Mom: Momentum fast.
WSFG Weekly
- Short-Term
- WSFG Current: -1%
- F0%/NTZ' Bias: Price Below,
- WSFG Trend: Down.
MSFG Month Sep
- Intermediate-Term
- MSFG Current: 59%
- F0%/NTZ' Bias: Price Above,
- MSFG Trend: Up.
YSFG Year 2025
- Long-Term
- YSFG Current: 65%
- F0%/NTZ' Bias: Price Above,
- YSFG Trend: Up.
Swing Pivots
- (Short-Term) 1. Pvt. Trend: DTrend,
- (Intermediate-Term) 2. HiLo Trend: UTrend,
- 3. Pvt. Evolve: Pvt low 112205,
- 4. Pvt. Next: Pvt high 126005,
- 5. Levels R: 126005, 122410, 119004, 117470, 114741,
- 6. Levels S: 112205, 111143, 107790, 78325, 58665, 52240, 40180.
Weekly Benchmarks
- (Intermediate-Term) 5 Week: 116160 Down Trend,
- (Intermediate-Term) 10 Week: 115000 Down Trend,
- (Long-Term) 20 Week: 112205 Up Trend,
- (Long-Term) 55 Week: 84500 Up Trend,
- (Long-Term) 100 Week: 64861 Up Trend,
- (Long-Term) 200 Week: 58665 Up Trend.
Recent Trade Signals
- 18 Sep 2025: Long BTC 09-25 @ 118000 Signals.USAR-WSFG
Overall Rating
- Short-Term: Bearish,
- Intermediate-Term: Bullish,
- Long-Term: Bullish.
Key Insights Summary
BTC CME Futures are currently experiencing a fast momentum pullback after a strong rally, with price action showing large bars and the last price at 112205. The short-term trend has shifted bearish, as indicated by the WSFG trend down and price below the NTZ center, with both 5 and 10 week moving averages turning down. However, the intermediate and long-term outlooks remain bullish, supported by the MSFG and YSFG trends up, and all long-term moving averages (20, 55, 100, 200 week) in uptrends. Swing pivots show the current evolution at a pivot low, with the next significant resistance at 126005 and support at 112205 and 111143. The recent long signal at 118000 suggests the market is in a corrective phase within a broader uptrend. Overall, the market is consolidating after a strong advance, with short-term weakness but underlying strength in the higher timeframes, typical of a trend continuation setup after a corrective retracement.
Chart Analysis ATS AI Generated: 2025-09-19 07:04 for Informational use only, not trading advice. Terms and Risk Disclosure Copyright © 2025. Algo Trading Systems LLC.
