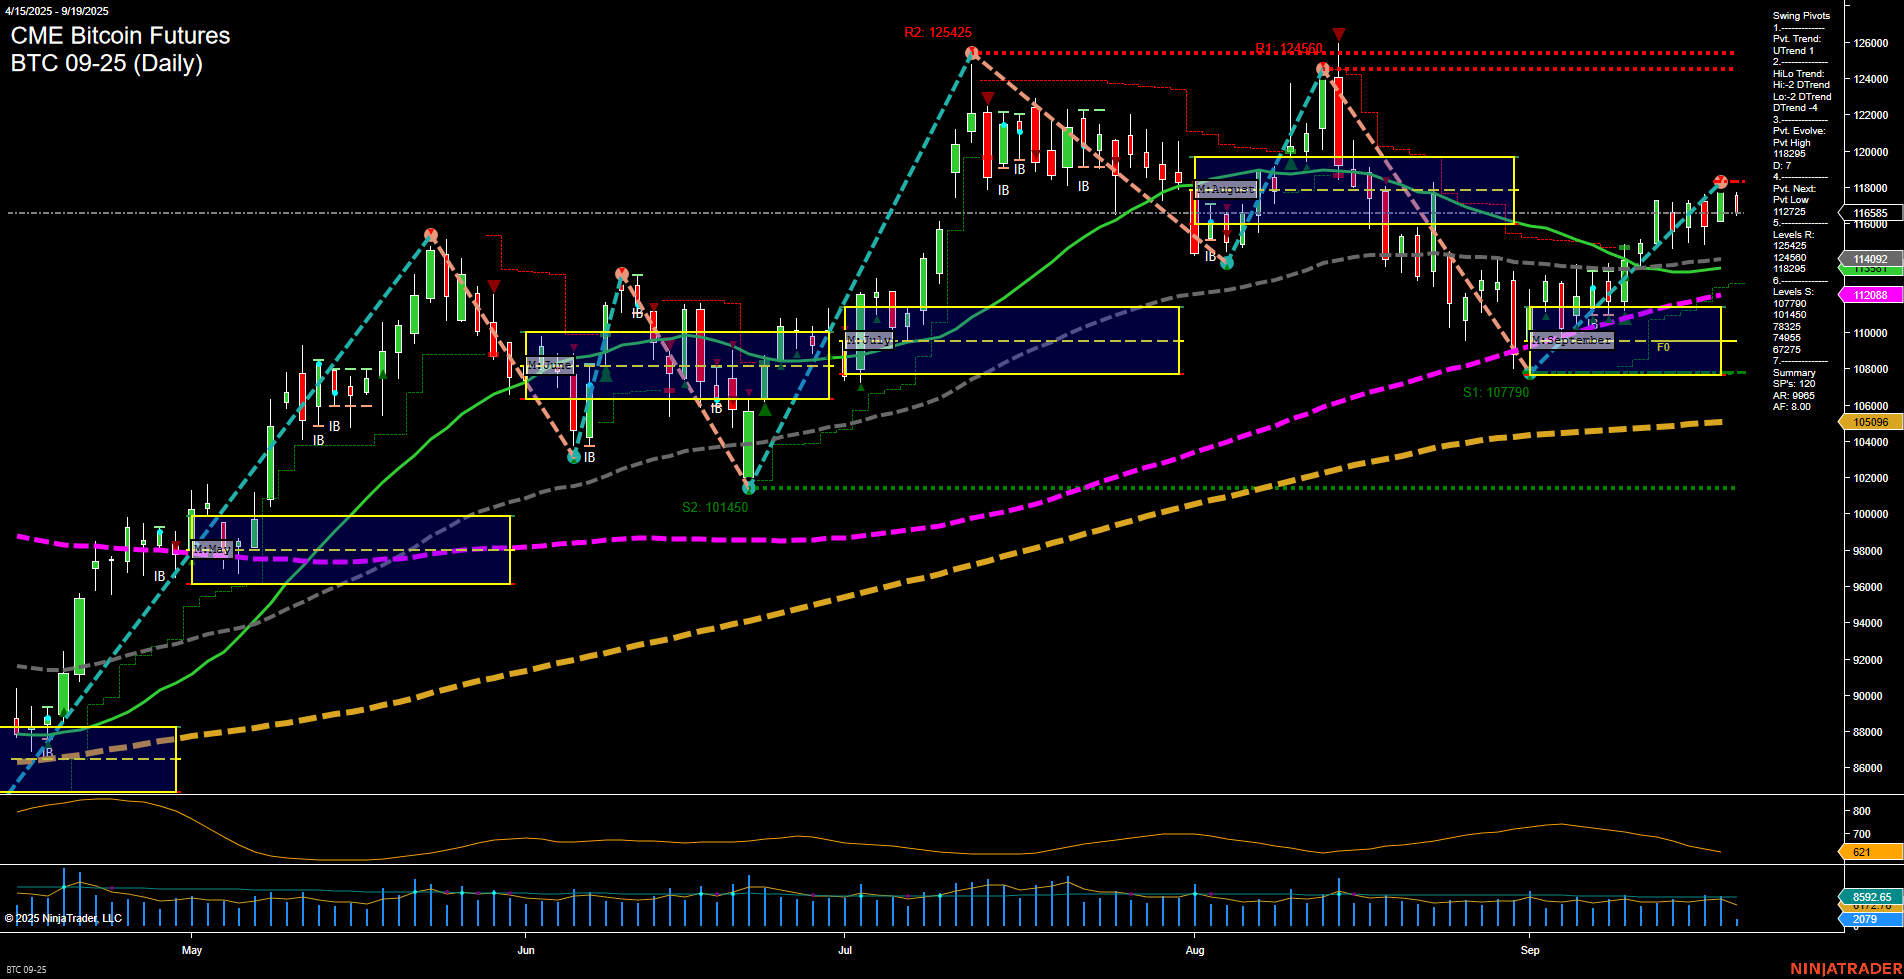
BTC CME Bitcoin Futures Daily Chart Analysis: 2025-Sep-19 07:03 CT
Price Action
- Last: 116850,
- Bars: Medium,
- Mom: Momentum average.
WSFG Weekly
- Short-Term
- WSFG Current: -1%
- F0%/NTZ' Bias: Price Below,
- WSFG Trend: Down.
MSFG Month Sep
- Intermediate-Term
- MSFG Current: 59%
- F0%/NTZ' Bias: Price Above,
- MSFG Trend: Up.
YSFG Year 2025
- Long-Term
- YSFG Current: 65%
- F0%/NTZ' Bias: Price Above,
- YSFG Trend: Up.
Swing Pivots
- (Short-Term) 1. Pvt. Trend: UTrend,
- (Intermediate-Term) 2. HiLo Trend: DTrend,
- 3. Pvt. Evolve: Pvt High 118269,
- 4. Pvt. Next: Pvt Low 112725,
- 5. Levels R: 125425, 124450, 118269,
- 6. Levels S: 112088, 107790, 101450.
Daily Benchmarks
- (Short-Term) 5 Day: 116095 Up Trend,
- (Short-Term) 10 Day: 114092 Up Trend,
- (Intermediate-Term) 20 Day: 112088 Up Trend,
- (Intermediate-Term) 55 Day: 112028 Up Trend,
- (Long-Term) 100 Day: 105096 Up Trend,
- (Long-Term) 200 Day: 105096 Up Trend.
Additional Metrics
Recent Trade Signals
- 18 Sep 2025: Long BTC 09-25 @ 118000 Signals.USAR-WSFG
Overall Rating
- Short-Term: Bullish,
- Intermediate-Term: Neutral,
- Long-Term: Bullish.
Key Insights Summary
BTC CME Bitcoin Futures are showing a constructive technical structure from a swing trader’s perspective. Price is currently consolidating just below recent swing resistance (118269) after a strong recovery from the September lows, with medium-sized bars and average momentum indicating a balanced market. The short-term trend has shifted bullish, supported by all short and intermediate moving averages trending up, and a recent long signal. However, the intermediate-term HiLo pivot trend remains down, suggesting the market is still digesting the prior selloff and could be in a transition phase. The monthly and yearly session fib grids both show price above their NTZ centers, confirming an overall upward bias for the medium and long term. Key resistance levels are clustered above at 118269, 124450, and 125425, while support is well-defined at 112088 and 107790. Volatility is moderate, and volume remains healthy. The market is in a potential trend continuation phase, but with some overhead resistance to clear before a breakout. Overall, the structure favors bullish continuation in the long term, with short-term momentum supportive, but intermediate-term traders may watch for confirmation of a sustained uptrend above resistance.
Chart Analysis ATS AI Generated: 2025-09-19 07:04 for Informational use only, not trading advice. Terms and Risk Disclosure Copyright © 2025. Algo Trading Systems LLC.
