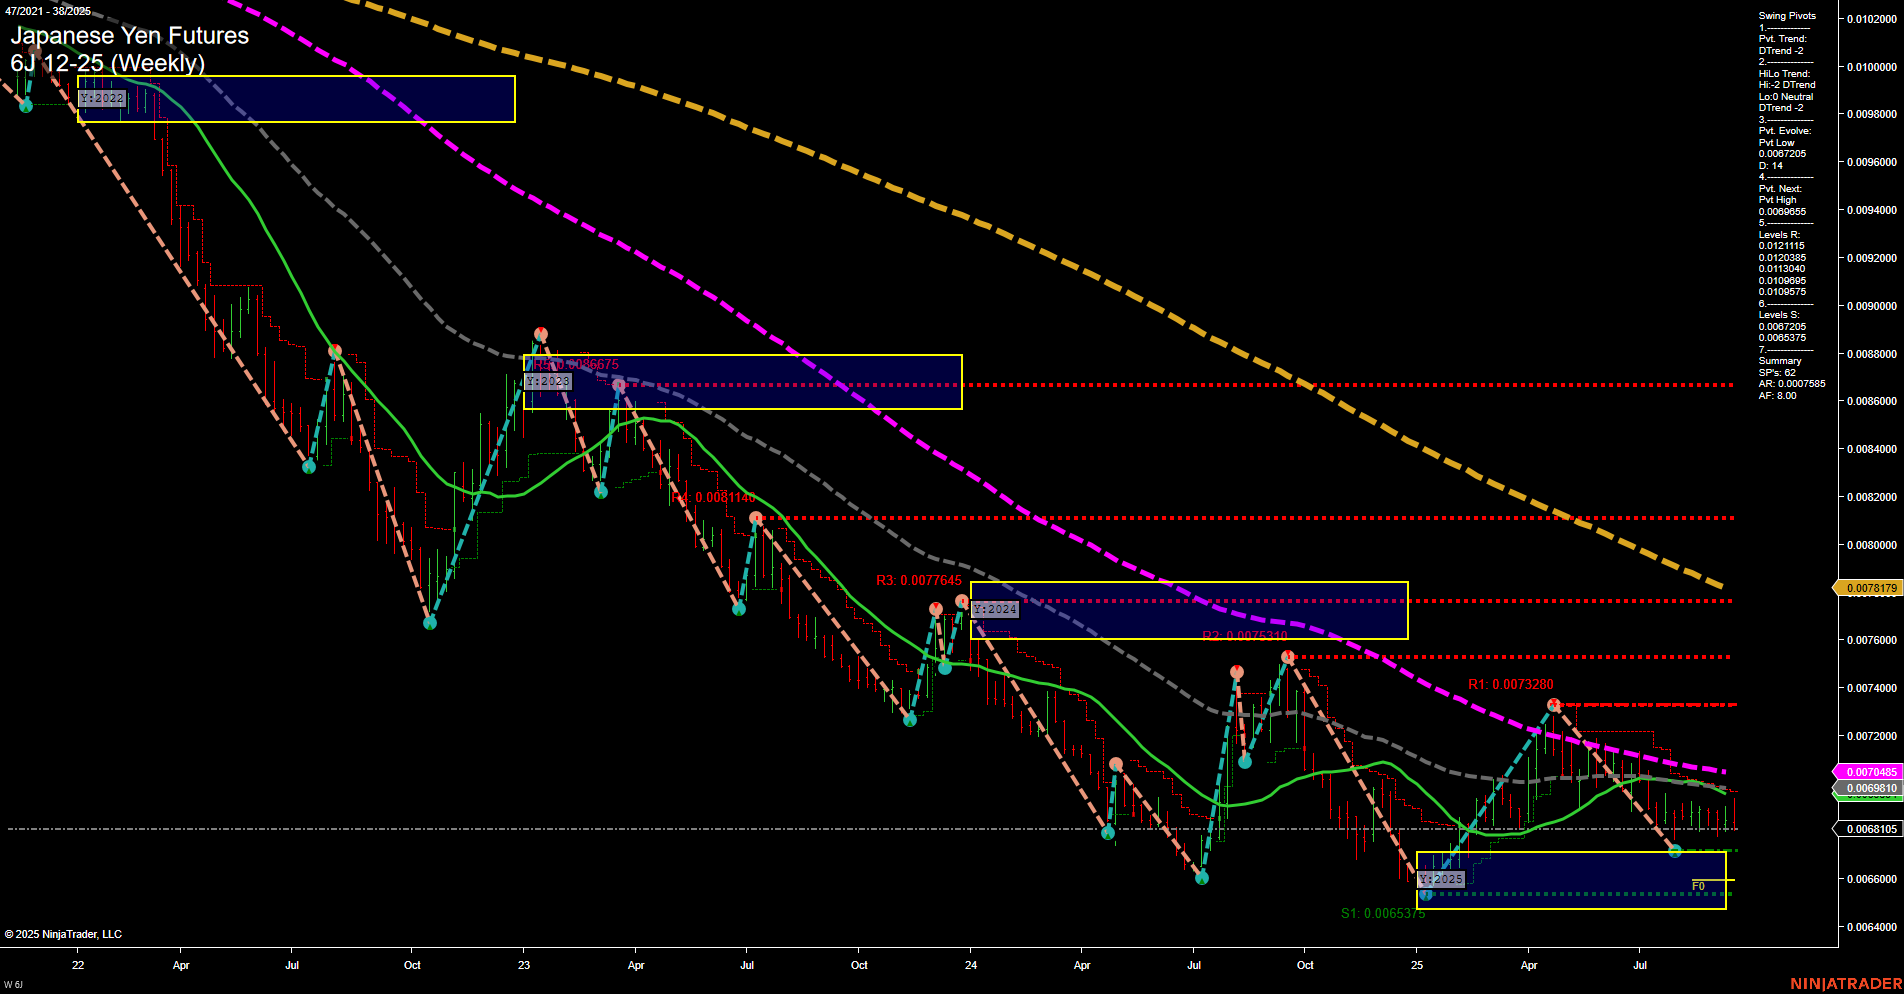
6J Japanese Yen Futures Weekly Chart Analysis: 2025-Sep-19 07:03 CT
Price Action
- Last: 0.0068615,
- Bars: Small to Medium,
- Mom: Momentum slow.
WSFG Weekly
- Short-Term
- WSFG Current: -30%
- F0%/NTZ' Bias: Price Below,
- WSFG Trend: Down.
MSFG Month Sep
- Intermediate-Term
- MSFG Current: -27%
- F0%/NTZ' Bias: Price Below,
- MSFG Trend: Down.
YSFG Year 2025
- Long-Term
- YSFG Current: 18%
- F0%/NTZ' Bias: Price Above,
- YSFG Trend: Up.
Swing Pivots
- (Short-Term) 1. Pvt. Trend: DTrend,
- (Intermediate-Term) 2. HiLo Trend: DTrend,
- 3. Pvt. Evolve: Pvt Low 0.0067205,
- 4. Pvt. Next: Pvt High 0.007148,
- 5. Levels R: 0.0081140, 0.0077645, 0.0073280, 0.0072540, 0.007148, 0.0070875,
- 6. Levels S: 0.0067205, 0.0065375.
Weekly Benchmarks
- (Intermediate-Term) 5 Week: 0.0068615 Down Trend,
- (Intermediate-Term) 10 Week: 0.0069855 Down Trend,
- (Long-Term) 20 Week: 0.0070485 Down Trend,
- (Long-Term) 55 Week: 0.0078179 Down Trend,
- (Long-Term) 100 Week: 0.007485 Down Trend,
- (Long-Term) 200 Week: 0.0089610 Down Trend.
Recent Trade Signals
- 19 Sep 2025: Short 6J 12-25 @ 0.0068175 Signals.USAR-MSFG
- 19 Sep 2025: Short 6J 12-25 @ 0.006821 Signals.USAR-WSFG
- 18 Sep 2025: Short 6J 12-25 @ 0.006868 Signals.USAR.TR120
Overall Rating
- Short-Term: Bearish,
- Intermediate-Term: Bearish,
- Long-Term: Neutral.
Key Insights Summary
The Japanese Yen Futures (6J) weekly chart continues to reflect a dominant bearish structure in both the short- and intermediate-term timeframes, as evidenced by the persistent downtrend in the WSFG and MSFG grids, as well as the swing pivot trends. Price remains below the key NTZ/F0% levels on both the weekly and monthly grids, reinforcing the downward bias. Multiple recent short signals further confirm the prevailing negative sentiment. All benchmark moving averages from 5-week to 200-week are trending down, with price trading below these levels, indicating sustained selling pressure and a lack of bullish momentum. However, the yearly session grid (YSFG) shows a modest upward trend, suggesting some stabilization or potential for a longer-term base, but this is not yet reflected in the shorter timeframes. Support is clustered near 0.0067205 and 0.0065375, while resistance levels are stacked above, with no immediate signs of a reversal. The market is currently in a consolidation phase with slow momentum and small to medium bars, indicating a pause or potential for further downside continuation unless a significant catalyst emerges. Overall, the technical landscape remains bearish in the near to intermediate term, with long-term conditions showing early signs of possible stabilization.
Chart Analysis ATS AI Generated: 2025-09-19 07:03 for Informational use only, not trading advice. Terms and Risk Disclosure Copyright © 2025. Algo Trading Systems LLC.
