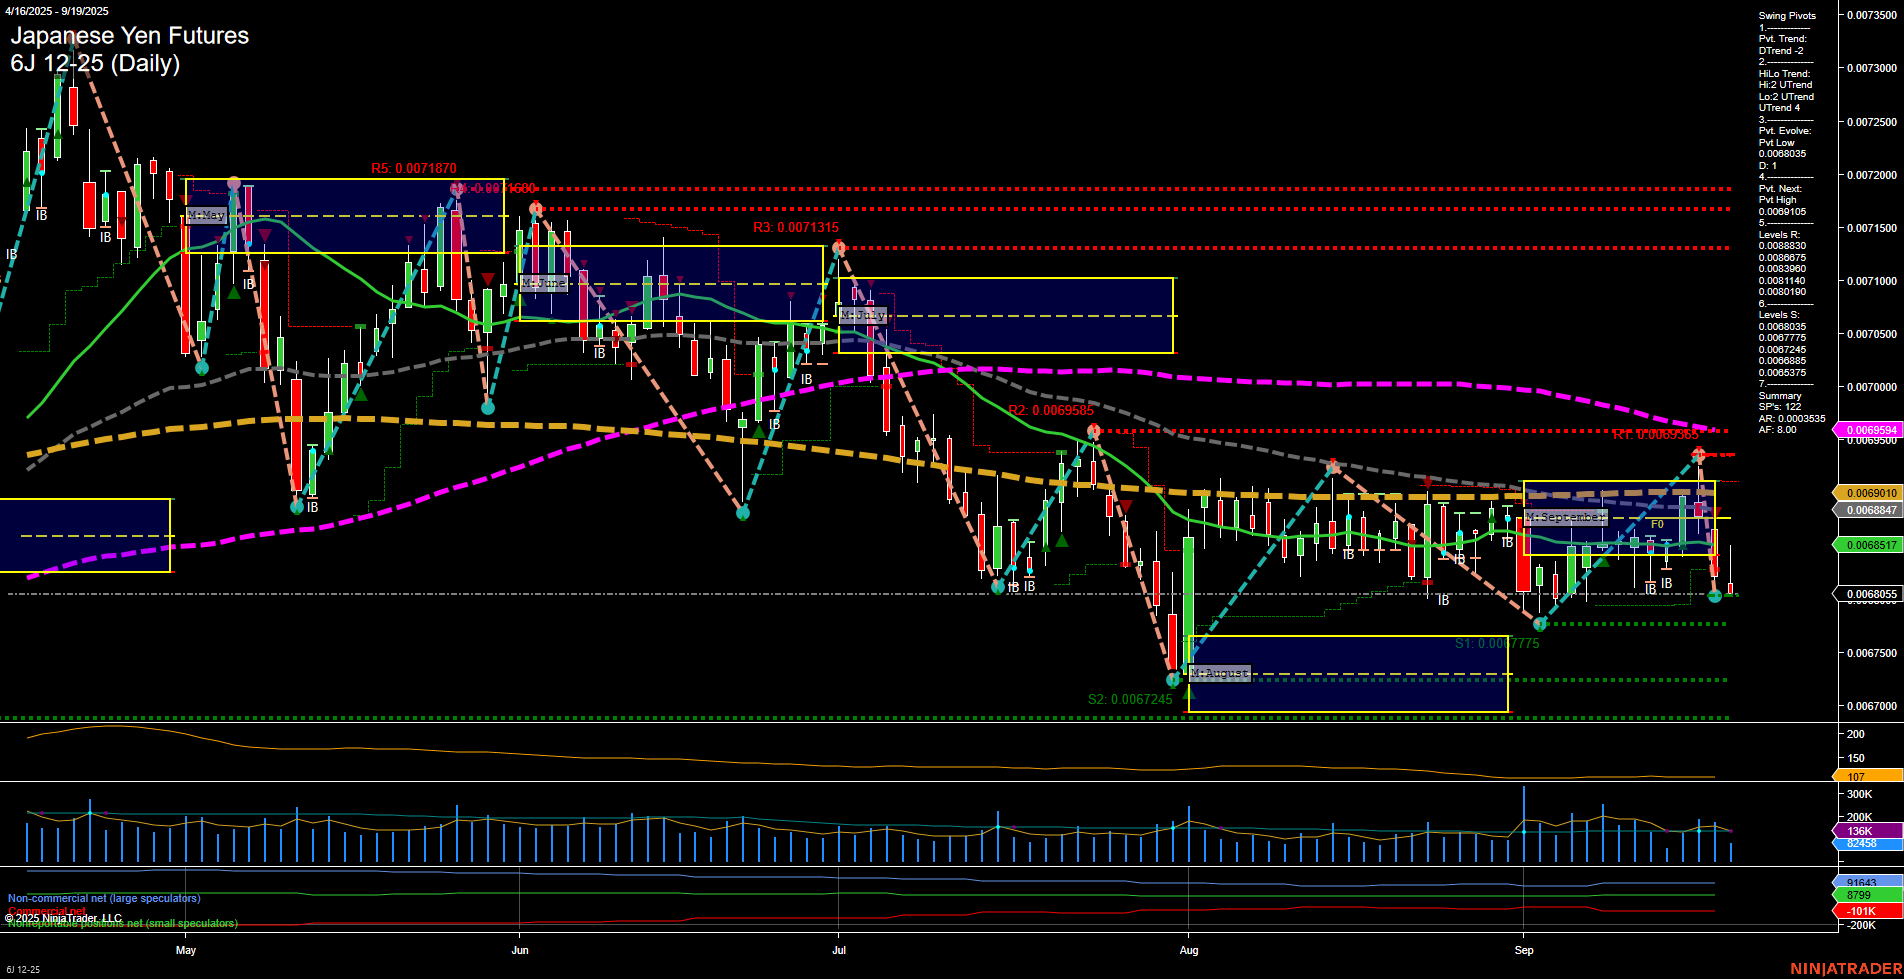
6J Japanese Yen Futures Daily Chart Analysis: 2025-Sep-19 07:02 CT
Price Action
- Last: 0.0068175,
- Bars: Medium,
- Mom: Momentum average.
WSFG Weekly
- Short-Term
- WSFG Current: -30%
- F0%/NTZ' Bias: Price Below,
- WSFG Trend: Down.
MSFG Month Sep
- Intermediate-Term
- MSFG Current: -27%
- F0%/NTZ' Bias: Price Below,
- MSFG Trend: Down.
YSFG Year 2025
- Long-Term
- YSFG Current: 18%
- F0%/NTZ' Bias: Price Above,
- YSFG Trend: Up.
Swing Pivots
- (Short-Term) 1. Pvt. Trend: DTrend,
- (Intermediate-Term) 2. HiLo Trend: UTrend,
- 3. Pvt. Evolve: Pvt low 0.0068055,
- 4. Pvt. Next: Pvt high 0.0069105,
- 5. Levels R: 0.0073500, 0.0073000, 0.0071870, 0.0071315, 0.0070585, 0.0069585, 0.0069105,
- 6. Levels S: 0.0068055, 0.0067775, 0.0067425, 0.0067245, 0.0066835, 0.0065835, 0.0065375.
Daily Benchmarks
- (Short-Term) 5 Day: 0.0069051 Down Trend,
- (Short-Term) 10 Day: 0.0068847 Down Trend,
- (Intermediate-Term) 20 Day: 0.0068517 Down Trend,
- (Intermediate-Term) 55 Day: 0.0069594 Down Trend,
- (Long-Term) 100 Day: 0.0069910 Down Trend,
- (Long-Term) 200 Day: 0.0070594 Down Trend.
Additional Metrics
Recent Trade Signals
- 19 Sep 2025: Short 6J 12-25 @ 0.0068175 Signals.USAR-MSFG
- 19 Sep 2025: Short 6J 12-25 @ 0.006821 Signals.USAR-WSFG
- 18 Sep 2025: Short 6J 12-25 @ 0.006868 Signals.USAR.TR120
Overall Rating
- Short-Term: Bearish,
- Intermediate-Term: Bearish,
- Long-Term: Neutral.
Key Insights Summary
The 6J Japanese Yen futures daily chart is showing a clear short-term and intermediate-term bearish bias, with price action breaking below both the weekly and monthly session fib grid NTZ zones and all key moving averages trending down. The most recent swing pivot trend is down, with the next potential reversal only above 0.0069105, while support levels are clustered just below the current price, suggesting a test of lower levels is possible. The intermediate-term HiLo trend remains up, but this is being challenged by the current downward momentum and recent short trade signals. Long-term, the yearly fib grid trend is still up, but price is well below the 100 and 200 day moving averages, indicating that the longer-term uptrend is under pressure. Volatility is moderate, and volume is steady, supporting the current move. Overall, the technical structure favors continued downside in the short and intermediate term, with the potential for further tests of support unless a strong reversal develops.
Chart Analysis ATS AI Generated: 2025-09-19 07:03 for Informational use only, not trading advice. Terms and Risk Disclosure Copyright © 2025. Algo Trading Systems LLC.
