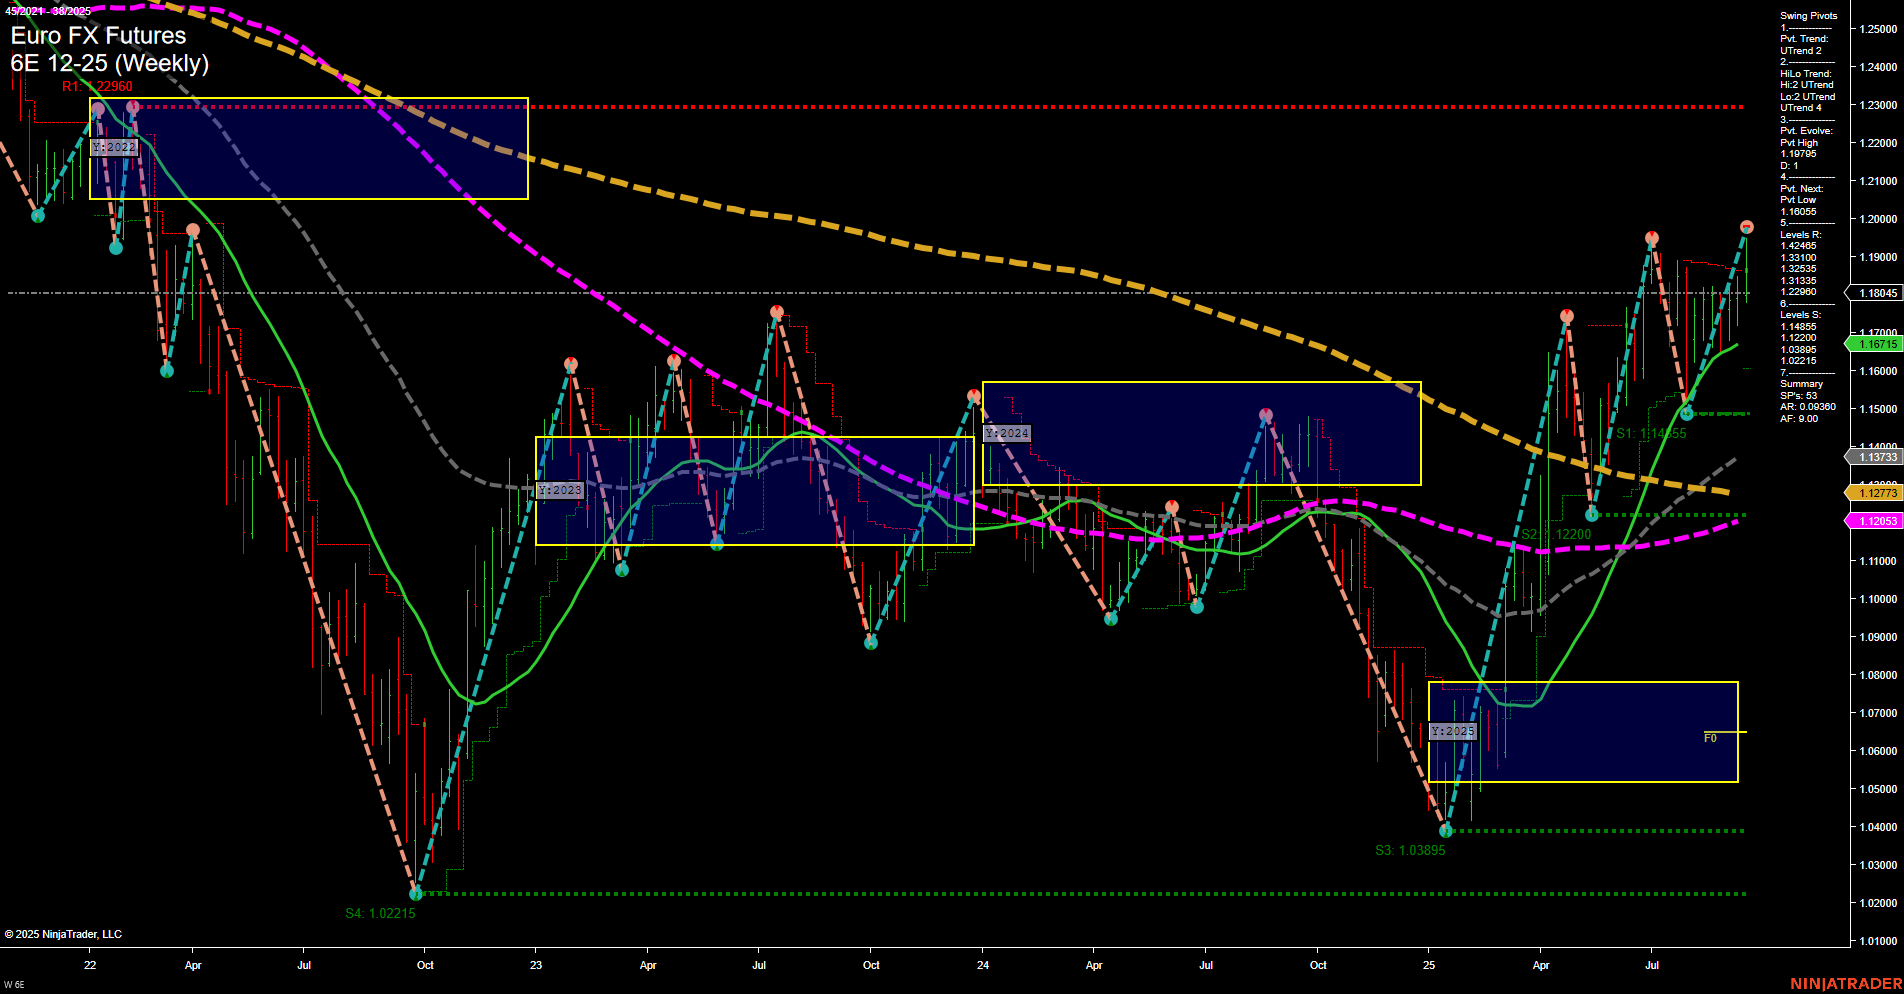
6E Euro FX Futures Weekly Chart Analysis: 2025-Sep-19 07:02 CT
Price Action
- Last: 1.16715,
- Bars: Medium,
- Mom: Momentum average.
WSFG Weekly
- Short-Term
- WSFG Current: -1%
- F0%/NTZ' Bias: Price Below,
- WSFG Trend: Down.
MSFG Month Sep
- Intermediate-Term
- MSFG Current: 4%
- F0%/NTZ' Bias: Price Above,
- MSFG Trend: Up.
YSFG Year 2025
- Long-Term
- YSFG Current: 87%
- F0%/NTZ' Bias: Price Above,
- YSFG Trend: Up.
Swing Pivots
- (Short-Term) 1. Pvt. Trend: UTrend,
- (Intermediate-Term) 2. HiLo Trend: UTrend,
- 3. Pvt. Evolve: Pvt low 1.11455,
- 4. Pvt. Next: Pvt high 1.23310,
- 5. Levels R: 1.23310, 1.21335, 1.19805,
- 6. Levels S: 1.11455, 1.03895, 1.02215.
Weekly Benchmarks
- (Intermediate-Term) 5 Week: 1.18045 Up Trend,
- (Intermediate-Term) 10 Week: 1.17373 Up Trend,
- (Long-Term) 20 Week: 1.16715 Up Trend,
- (Long-Term) 55 Week: 1.12713 Up Trend,
- (Long-Term) 100 Week: 1.12053 Up Trend,
- (Long-Term) 200 Week: 1.20360 Down Trend.
Recent Trade Signals
- 18 Sep 2025: Short 6E 12-25 @ 1.18725 Signals.USAR.TR120
- 16 Sep 2025: Long 6E 12-25 @ 1.1856 Signals.USAR-MSFG
- 15 Sep 2025: Long 6E 12-25 @ 1.18155 Signals.USAR-WSFG
Overall Rating
- Short-Term: Neutral,
- Intermediate-Term: Bullish,
- Long-Term: Bullish.
Key Insights Summary
The 6E Euro FX Futures weekly chart shows a market transitioning from a period of consolidation and recovery into a more defined uptrend, especially on the intermediate and long-term horizons. Price action is currently above most key moving averages, with the 20, 55, and 100-week benchmarks all trending upward, indicating sustained bullish momentum. The short-term WSFG trend is down, but both swing pivot and HiLo trends are up, suggesting recent pullbacks are being bought and the market is making higher lows. The yearly and monthly session fib grids both show price well above their NTZ/F0% levels, reinforcing the longer-term bullish structure. Resistance is layered above at 1.19805, 1.21335, and 1.23310, while support is strong at 1.11455 and below. Recent trade signals reflect mixed short-term action but a prevailing intermediate-term bullish bias. Overall, the chart reflects a market in the midst of a bullish recovery phase, with short-term volatility but a clear upward bias on larger timeframes.
Chart Analysis ATS AI Generated: 2025-09-19 07:02 for Informational use only, not trading advice. Terms and Risk Disclosure Copyright © 2025. Algo Trading Systems LLC.
