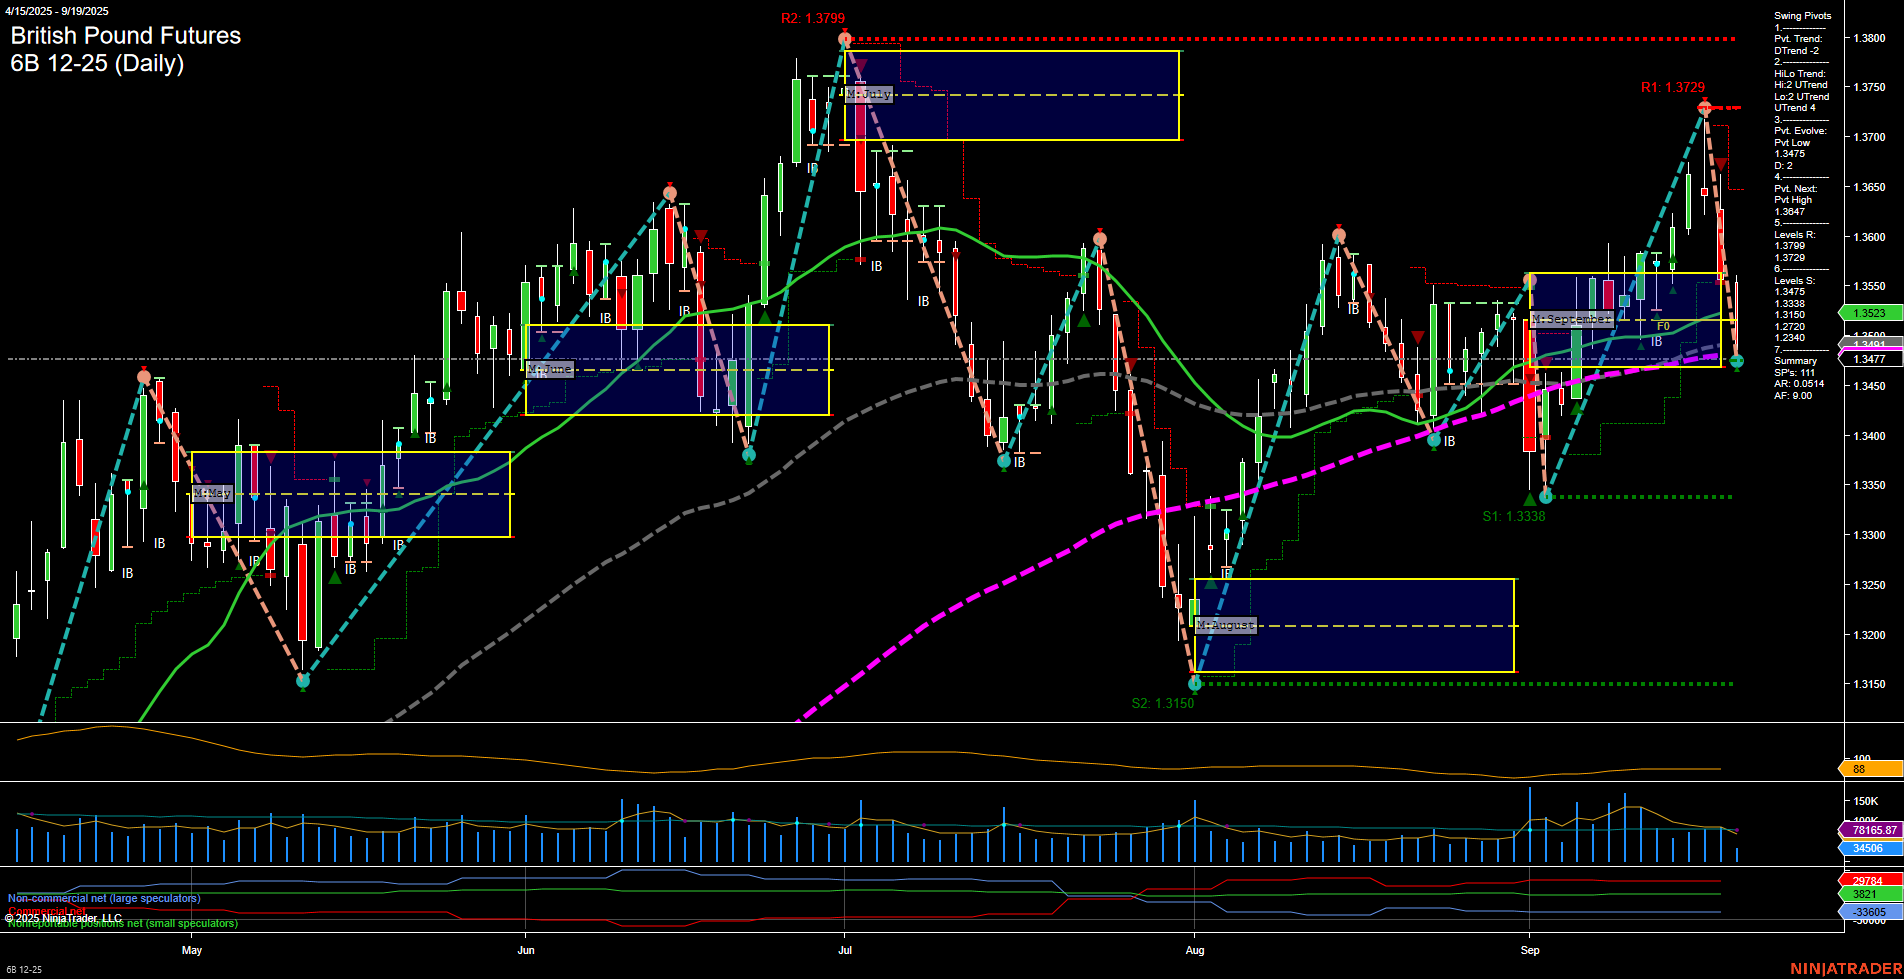
6B British Pound Futures Daily Chart Analysis: 2025-Sep-19 07:01 CT
Price Action
- Last: 1.3523,
- Bars: Large,
- Mom: Momentum fast.
WSFG Weekly
- Short-Term
- WSFG Current: -58%
- F0%/NTZ' Bias: Price Below,
- WSFG Trend: Down.
MSFG Month Sep
- Intermediate-Term
- MSFG Current: -12%
- F0%/NTZ' Bias: Price Below,
- MSFG Trend: Down.
YSFG Year 2025
- Long-Term
- YSFG Current: 50%
- F0%/NTZ' Bias: Price Above,
- YSFG Trend: Up.
Swing Pivots
- (Short-Term) 1. Pvt. Trend: DTrend,
- (Intermediate-Term) 2. HiLo Trend: UTrend,
- 3. Pvt. Evolve: Pvt low 1.3419,
- 4. Pvt. Next: Pvt high 1.3847,
- 5. Levels R: 1.3729, 1.3709, 1.3623, 1.3554,
- 6. Levels S: 1.3419, 1.3338, 1.3150.
Daily Benchmarks
- (Short-Term) 5 Day: 1.3551 Down Trend,
- (Short-Term) 10 Day: 1.3477 Down Trend,
- (Intermediate-Term) 20 Day: 1.3523 Down Trend,
- (Intermediate-Term) 55 Day: 1.3477 Up Trend,
- (Long-Term) 100 Day: 1.3447 Up Trend,
- (Long-Term) 200 Day: 1.3388 Up Trend.
Additional Metrics
Recent Trade Signals
- 18 Sep 2025: Short 6B 12-25 @ 1.355 Signals.USAR-WSFG
- 18 Sep 2025: Short 6B 12-25 @ 1.3554 Signals.USAR.TR120
- 18 Sep 2025: Long 6B 12-25 @ 1.3623 Signals.USAR-MSFG
- 15 Sep 2025: Long 6B 12-25 @ 1.3611 Signals.USAR.TR720
Overall Rating
- Short-Term: Bearish,
- Intermediate-Term: Neutral,
- Long-Term: Bullish.
Key Insights Summary
The British Pound Futures (6B) daily chart shows a recent sharp move lower, with large bars and fast momentum indicating heightened volatility and a strong short-term bearish impulse. Price is currently below both the weekly and monthly session fib grid NTZs, confirming a downward bias in the short and intermediate timeframes. The short-term swing pivot trend has shifted to down, with the next significant support at 1.3419 and resistance at 1.3729. Moving averages in the short term are trending down, while intermediate and long-term averages remain in uptrends, suggesting a possible pullback within a broader bullish context. Recent trade signals reflect mixed activity, with both short and long entries triggered in the past week, highlighting a choppy environment. The overall structure suggests a short-term correction or retracement within a longer-term uptrend, with volatility elevated and the potential for further swings as the market digests recent moves.
Chart Analysis ATS AI Generated: 2025-09-19 07:01 for Informational use only, not trading advice. Terms and Risk Disclosure Copyright © 2025. Algo Trading Systems LLC.
