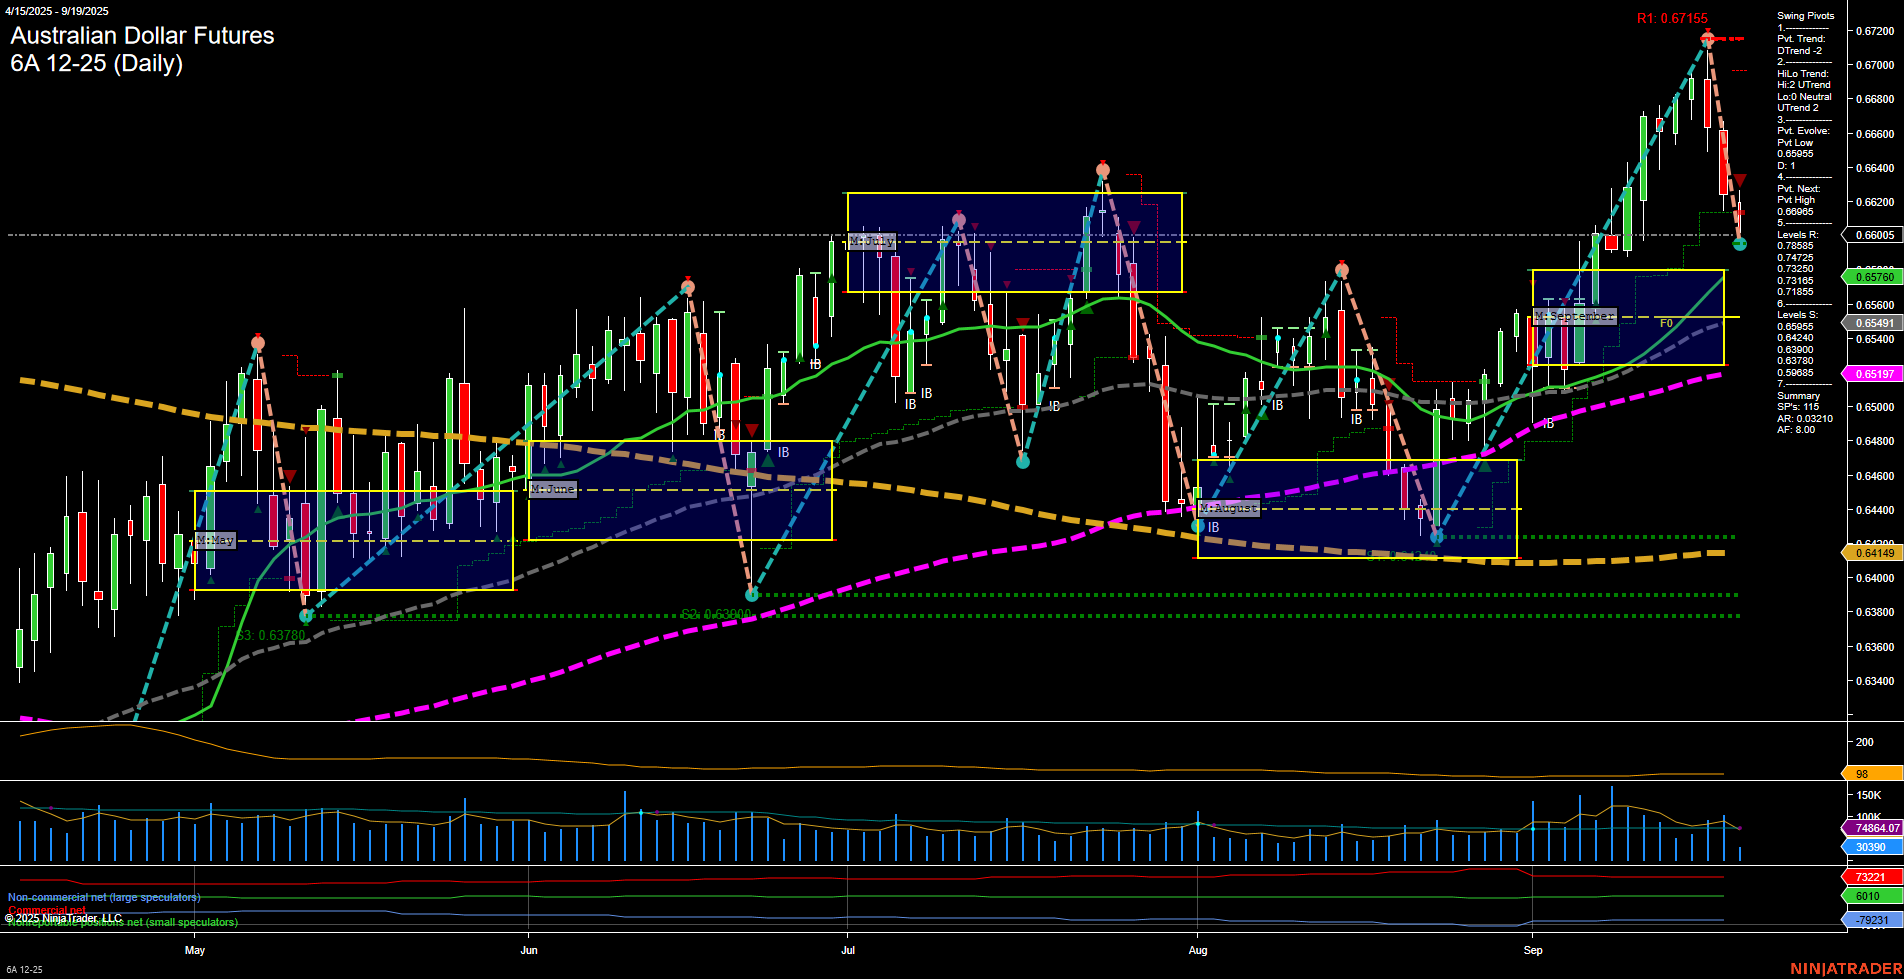
6A Australian Dollar Futures Daily Chart Analysis: 2025-Sep-19 07:00 CT
Price Action
- Last: 0.66095,
- Bars: Large,
- Mom: Momentum fast.
WSFG Weekly
- Short-Term
- WSFG Current: NA%
- F0%/NTZ' Bias: Price Neutral,
- WSFG Trend: Neutral.
MSFG Month Sep
- Intermediate-Term
- MSFG Current: NA%
- F0%/NTZ' Bias: Price Neutral,
- MSFG Trend: Neutral.
YSFG Year 2025
- Long-Term
- YSFG Current: NA%
- F0%/NTZ' Bias: Price Neutral,
- YSFG Trend: Neutral.
Swing Pivots
- (Short-Term) 1. Pvt. Trend: DTrend,
- (Intermediate-Term) 2. HiLo Trend: UTrend,
- 3. Pvt. Evolve: Pvt Low 0.66095,
- 4. Pvt. Next: Pvt High 0.67155,
- 5. Levels R: 0.67155, 0.66965, 0.66785, 0.66505,
- 6. Levels S: 0.66095, 0.65197, 0.64149.
Daily Benchmarks
- (Short-Term) 5 Day: 0.66500 Down Trend,
- (Short-Term) 10 Day: 0.66420 Down Trend,
- (Intermediate-Term) 20 Day: 0.65760 Up Trend,
- (Intermediate-Term) 55 Day: 0.65197 Up Trend,
- (Long-Term) 100 Day: 0.65197 Up Trend,
- (Long-Term) 200 Day: 0.64149 Up Trend.
Additional Metrics
Recent Trade Signals
- 18 Sep 2025: Short 6A 12-25 @ 0.6648 Signals.USAR-WSFG
- 17 Sep 2025: Short 6A 12-25 @ 0.66615 Signals.USAR.TR120
Overall Rating
- Short-Term: Bearish,
- Intermediate-Term: Bullish,
- Long-Term: Bullish.
Key Insights Summary
The Australian Dollar Futures (6A) daily chart shows a recent sharp pullback from swing highs, with large, fast-moving bars indicating heightened volatility and momentum to the downside. The short-term trend has shifted to bearish, as confirmed by the swing pivot DTrend and both the 5-day and 10-day moving averages turning down. However, the intermediate and long-term trends remain bullish, supported by the 20, 55, 100, and 200-day moving averages all trending upward. The price is currently testing a key support at 0.66095, with resistance levels stacked above at 0.66505 and higher. Recent trade signals have triggered short entries, reflecting the short-term bearish momentum. The market is in a corrective phase within a broader uptrend, suggesting a possible retracement or consolidation before the next directional move. Volatility remains elevated, and volume is robust, indicating active participation. The overall structure points to a short-term correction within a longer-term bullish context, with traders watching for either a continuation of the pullback or a resumption of the uptrend from support.
Chart Analysis ATS AI Generated: 2025-09-19 07:00 for Informational use only, not trading advice. Terms and Risk Disclosure Copyright © 2025. Algo Trading Systems LLC.
