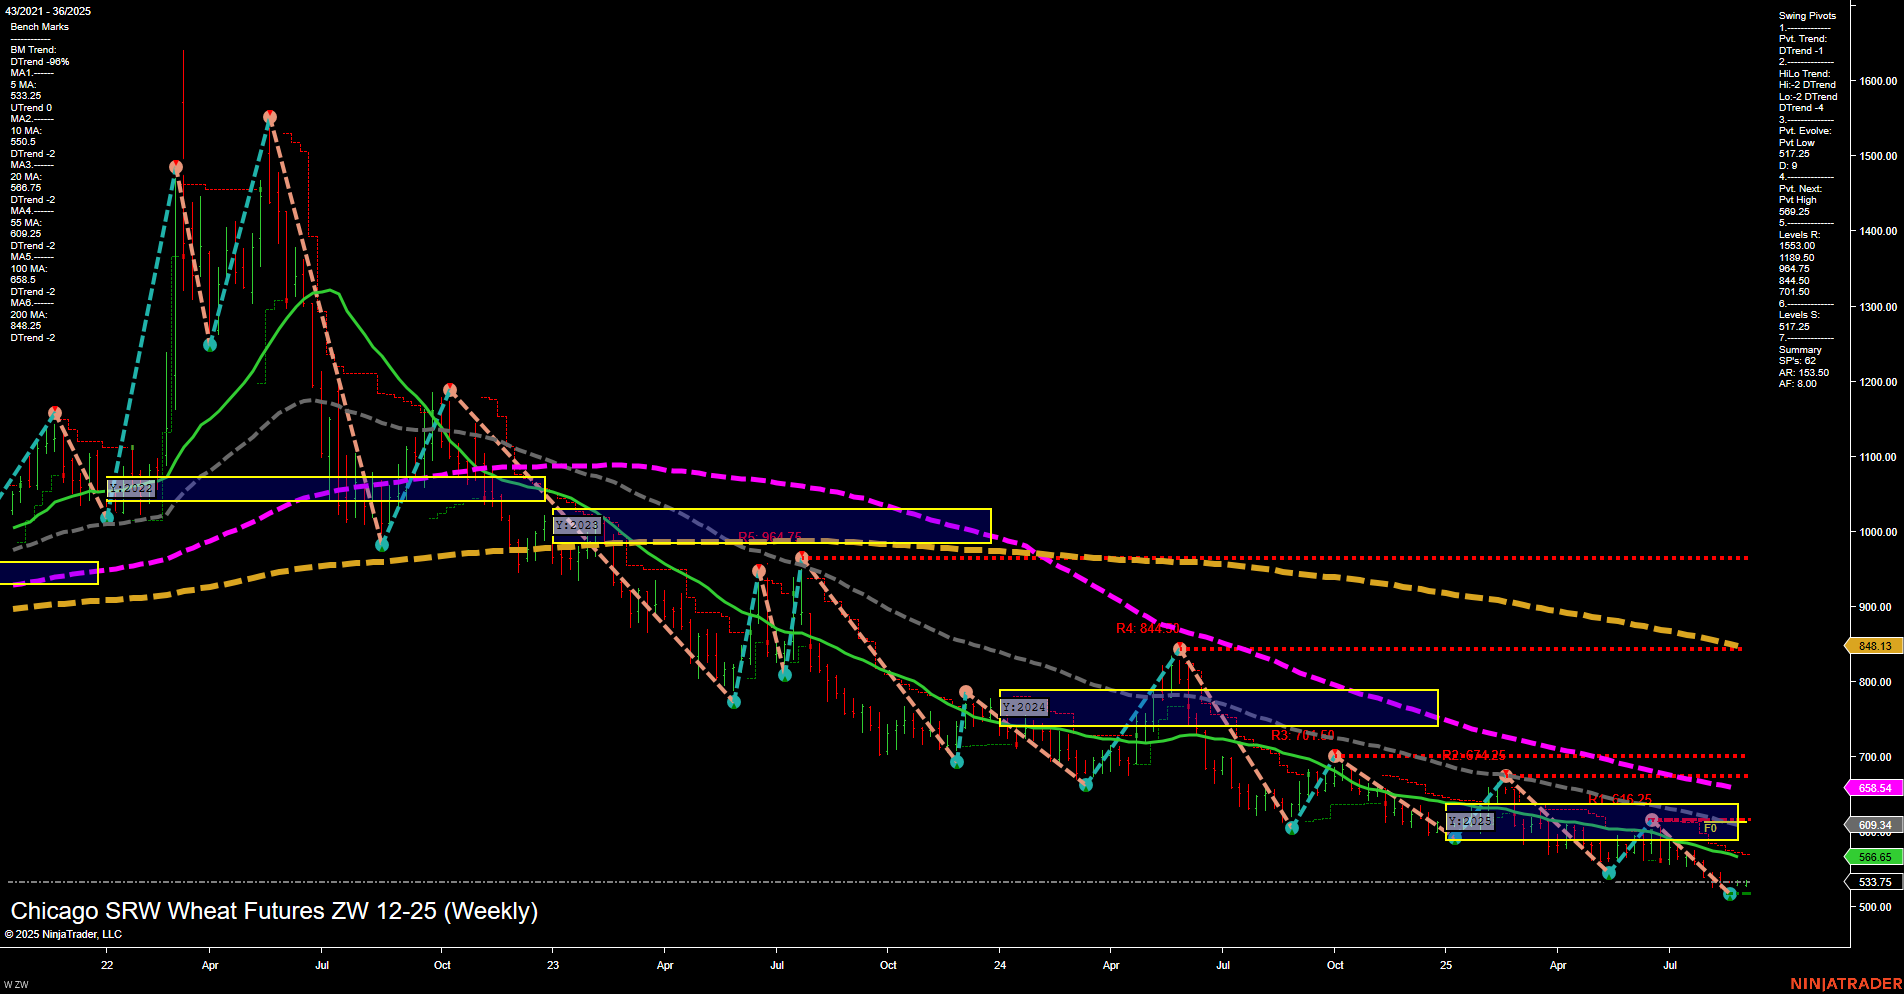
ZW Chicago SRW Wheat Futures Weekly Chart Analysis: 2025-Aug-31 18:14 CT
Price Action
- Last: 533.75,
- Bars: Small,
- Mom: Momentum slow.
WSFG Weekly
- Short-Term
- WSFG Current: 31%
- F0%/NTZ' Bias: Price Above,
- WSFG Trend: Up.
MSFG Month Aug
- Intermediate-Term
- MSFG Current: -25%
- F0%/NTZ' Bias: Price Below,
- MSFG Trend: Down.
YSFG Year 2025
- Long-Term
- YSFG Current: -33%
- F0%/NTZ' Bias: Price Below,
- YSFG Trend: Down.
Swing Pivots
- (Short-Term) 1. Pvt. Trend: DTrend,
- (Intermediate-Term) 2. HiLo Trend: DTrend,
- 3. Pvt. Evolve: Pvt Low 517.25,
- 4. Pvt. Next: Pvt High 596.25,
- 5. Levels R: 984.75, 848.40, 674.25, 646.25, 596.25,
- 6. Levels S: 517.25.
Weekly Benchmarks
- (Intermediate-Term) 5 Week: 586.65 Down Trend,
- (Intermediate-Term) 10 Week: 609.34 Down Trend,
- (Long-Term) 20 Week: 658.54 Down Trend,
- (Long-Term) 55 Week: 709.34 Down Trend,
- (Long-Term) 100 Week: 848.13 Down Trend,
- (Long-Term) 200 Week: 868.25 Down Trend.
Recent Trade Signals
- 29 Aug 2025: Long ZW 12-25 @ 529.75 Signals.USAR-WSFG
- 27 Aug 2025: Short ZW 12-25 @ 524.5 Signals.USAR.TR120
Overall Rating
- Short-Term: Neutral,
- Intermediate-Term: Bearish,
- Long-Term: Bearish.
Key Insights Summary
The ZW Chicago SRW Wheat Futures weekly chart shows a market that remains under significant long-term and intermediate-term pressure, with all major moving averages trending down and price action well below key resistance levels. The short-term WSFG trend has turned up, with price currently above the weekly NTZ center, but momentum is slow and bars are small, indicating a lack of strong conviction. Swing pivots confirm a dominant downtrend, with the most recent pivot low at 517.25 and the next potential resistance at 596.25. The recent trade signals reflect mixed short-term activity, with both long and short entries in close succession, highlighting choppy and indecisive price action. Overall, the market is consolidating near multi-year lows, with any short-term bounces facing heavy resistance from higher timeframe trends and moving averages. The technical landscape suggests a market in a prolonged corrective phase, with rallies likely to be met by sellers until a clear reversal pattern or breakout above major resistance levels emerges.
Chart Analysis ATS AI Generated: 2025-08-31 18:14 for Informational use only, not trading advice. Terms and Risk Disclosure Copyright © 2025. Algo Trading Systems LLC.
