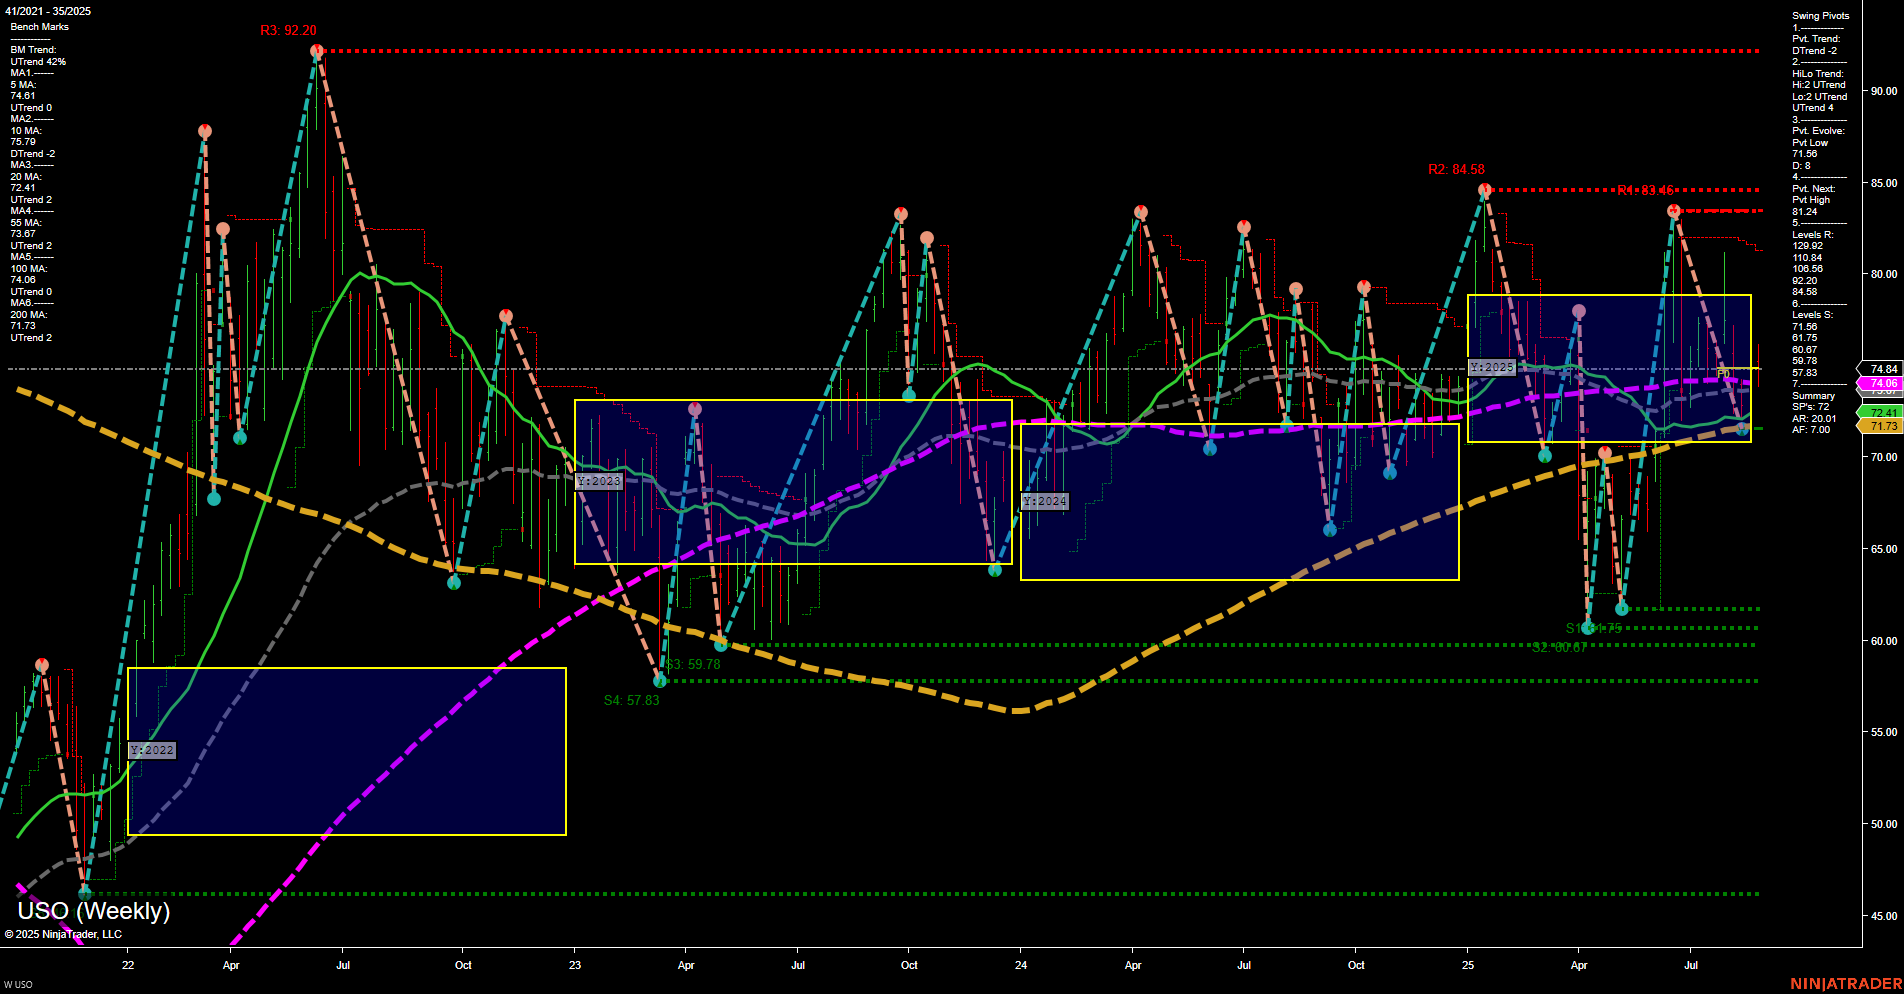
The USO weekly chart reflects a market in consolidation with a slight bearish tilt in the short term. Price action is contained within a medium range, and momentum is average, suggesting neither strong buying nor selling pressure. The short-term swing pivot trend is down, supported by both the 5- and 10-week moving averages trending lower. However, the intermediate-term HiLo trend remains up, and the 20- and 55-week moving averages are still in uptrends, indicating underlying support and a lack of decisive breakdown. Major resistance levels are clustered in the low-to-mid 80s, while support is well-defined in the low 60s. The price is currently near the 100-week moving average, which is flat to slightly down, and just below the 200-week moving average, which is still rising. The overall structure suggests a choppy, range-bound environment with no clear breakout or breakdown, and the market is likely to remain sensitive to macro news, seasonals, and energy sector developments. Futures swing traders may observe continued mean reversion and volatility within the established range, with the next significant directional move likely to be triggered by a test and rejection of key support or resistance levels.