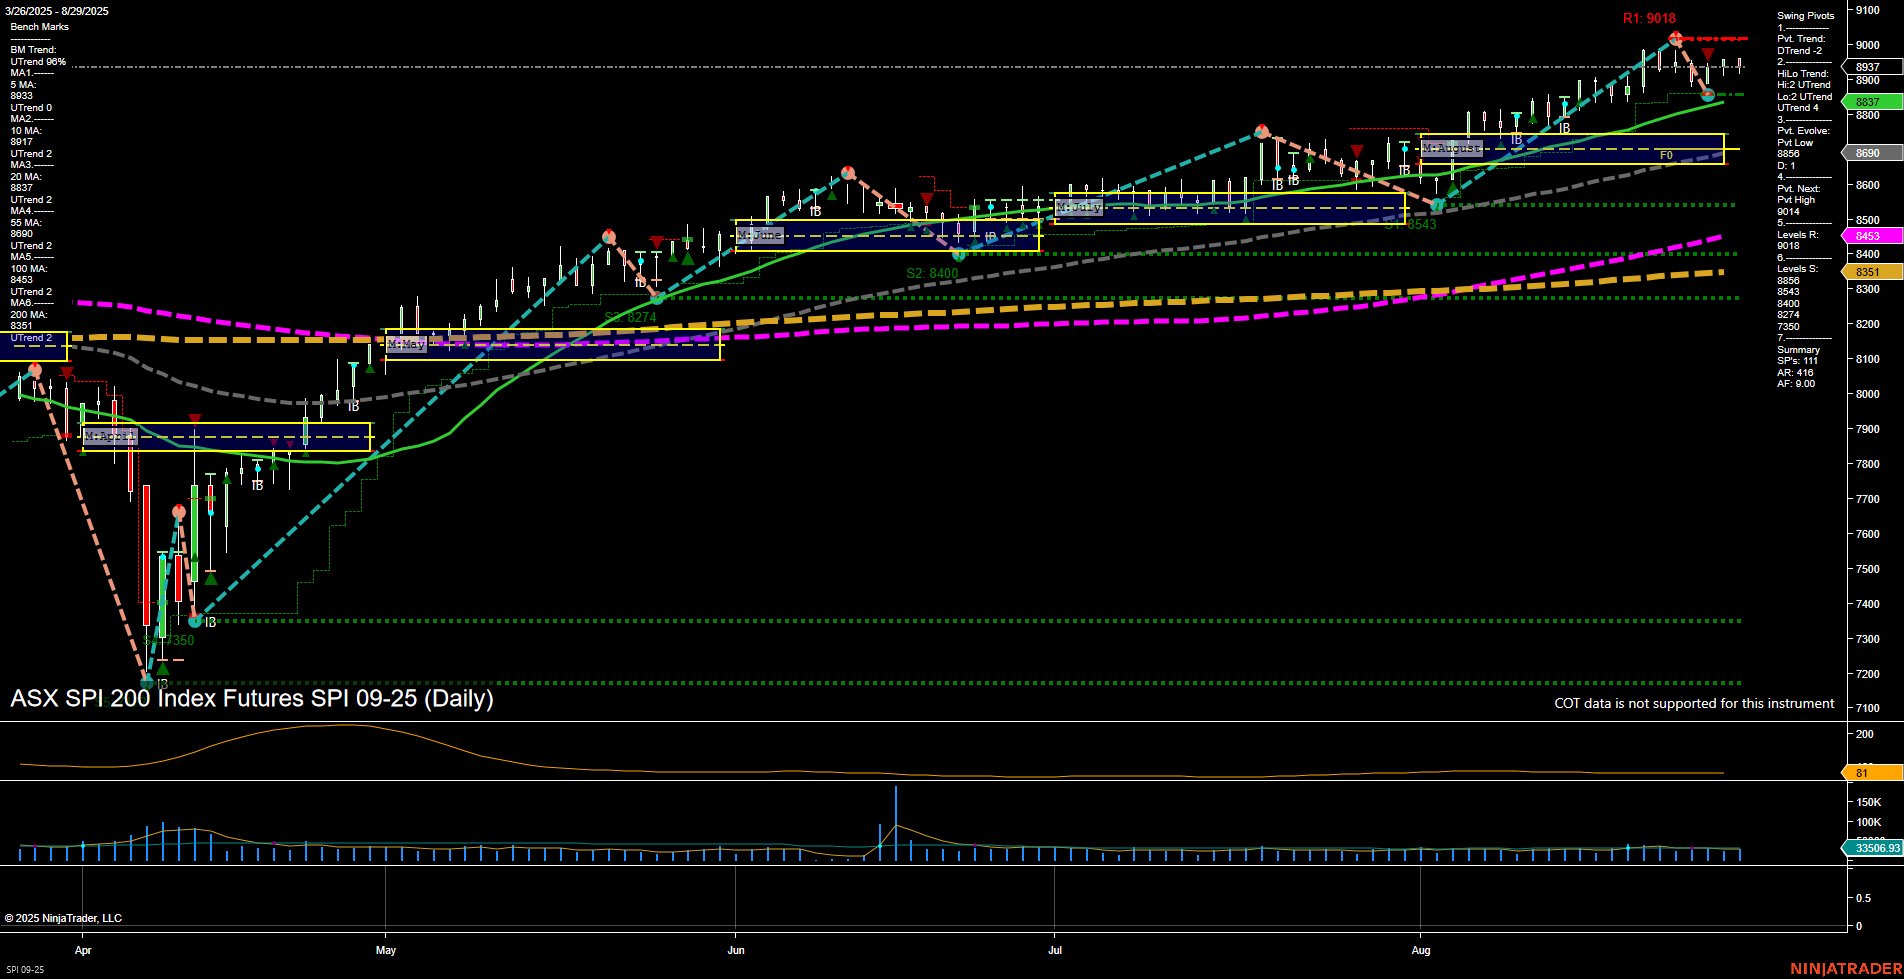
SPI ASX SPI 200 Index Futures Daily Chart Analysis: 2025-Aug-31 18:10 CT
Price Action
- Last: 8837,
- Bars: Medium,
- Mom: Momentum average.
WSFG Weekly
- Short-Term
- WSFG Current: NA%
- F0%/NTZ' Bias: Price Neutral,
- WSFG Trend: Neutral.
MSFG Month Aug
- Intermediate-Term
- MSFG Current: NA%
- F0%/NTZ' Bias: Price Neutral,
- MSFG Trend: Neutral.
YSFG Year 2025
- Long-Term
- YSFG Current: NA%
- F0%/NTZ' Bias: Price Neutral,
- YSFG Trend: Neutral.
Swing Pivots
- (Short-Term) 1. Pvt. Trend: DTrend,
- (Intermediate-Term) 2. HiLo Trend: UTrend,
- 3. Pvt. Evolve: Pvt Low 8800,
- 4. Pvt. Next: Pvt High 9018,
- 5. Levels R: 9018,
- 6. Levels S: 8800, 8590, 8453, 8400, 8351.
Daily Benchmarks
- (Short-Term) 5 Day: 8937 Down Trend,
- (Short-Term) 10 Day: 8877 Down Trend,
- (Intermediate-Term) 20 Day: 8837 Up Trend,
- (Intermediate-Term) 55 Day: 8600 Up Trend,
- (Long-Term) 100 Day: 8453 Up Trend,
- (Long-Term) 200 Day: 8400 Up Trend.
Additional Metrics
Overall Rating
- Short-Term: Neutral,
- Intermediate-Term: Bullish,
- Long-Term: Bullish.
Key Insights Summary
The SPI 200 Index Futures daily chart shows a market that has recently shifted to a short-term corrective phase, with the latest swing pivot indicating a downtrend (DTrend) and both the 5-day and 10-day moving averages turning down. However, the intermediate and long-term trends remain firmly bullish, as seen in the upward trajectory of the 20, 55, 100, and 200-day moving averages. The price is currently consolidating above a key support at 8800, with the next major resistance at the recent high of 9018. Volatility is moderate (ATR 96), and volume remains healthy. The overall structure suggests a pullback within a broader uptrend, with the market digesting gains after a strong rally. The neutral stance in the short term reflects this consolidation, while the underlying bullish bias persists for swing traders watching for trend continuation or a potential breakout above resistance.
Chart Analysis ATS AI Generated: 2025-08-31 18:10 for Informational use only, not trading advice. Terms and Risk Disclosure Copyright © 2025. Algo Trading Systems LLC.
