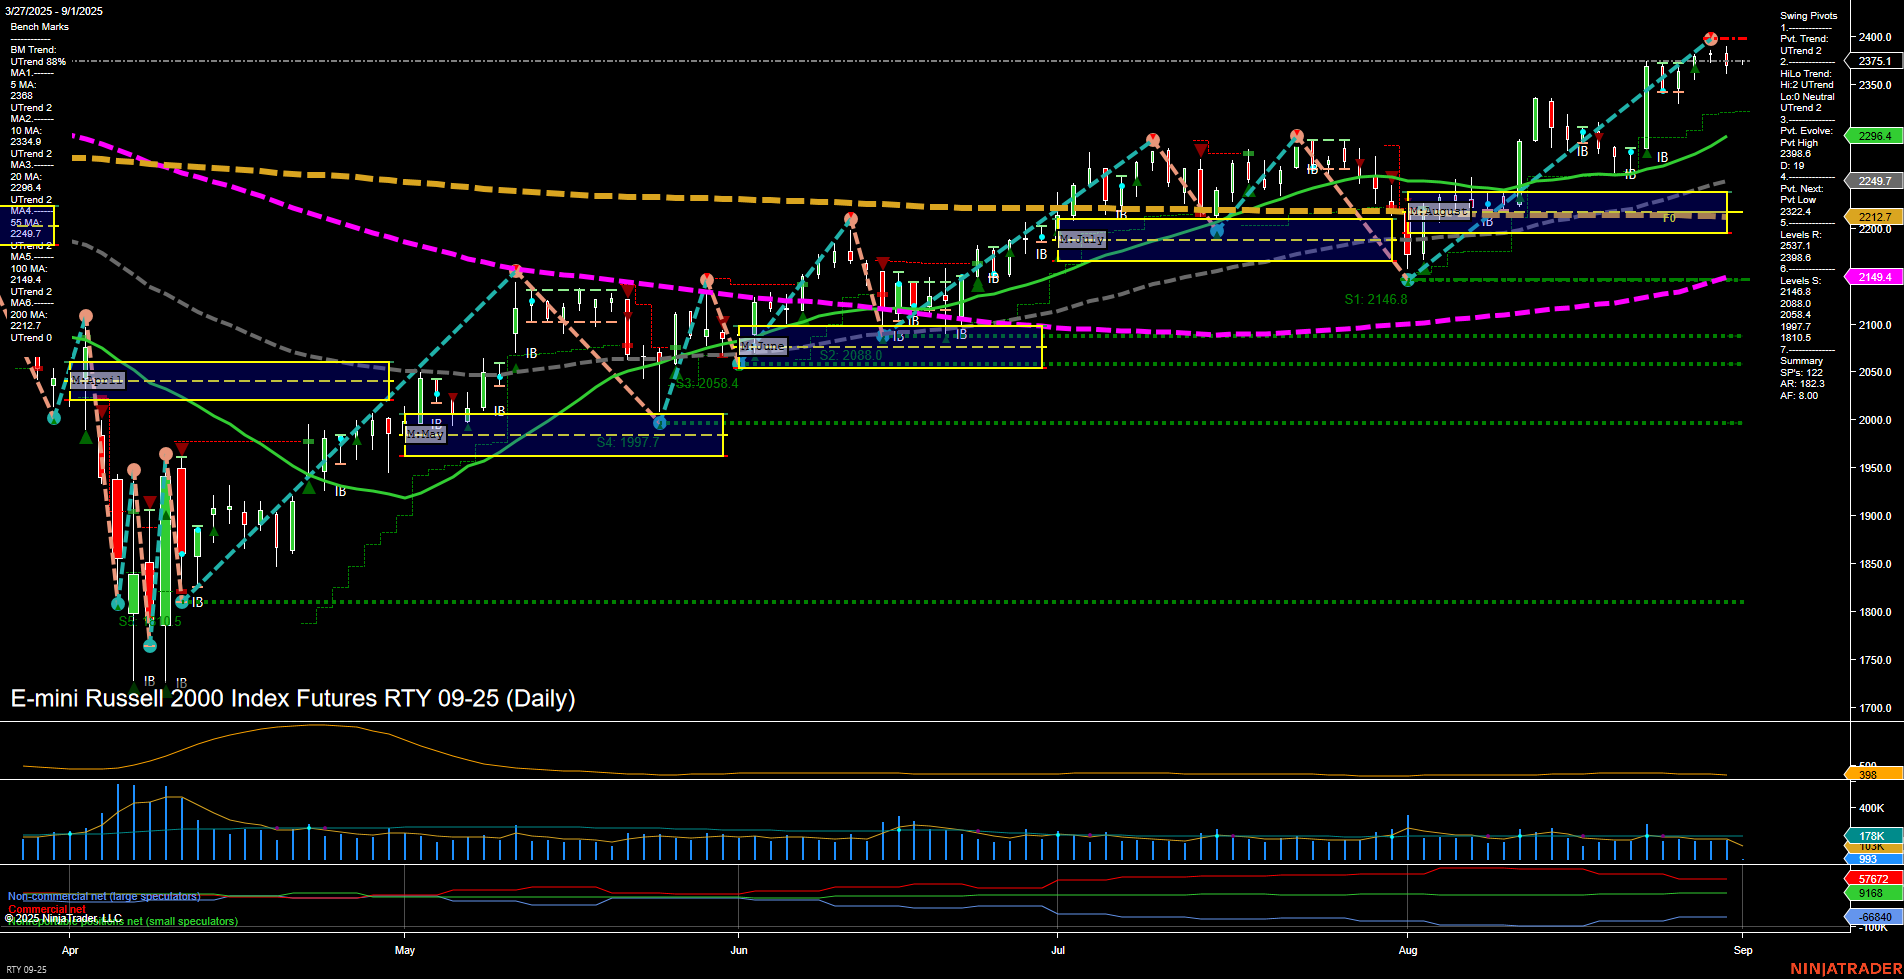
RTY E-mini Russell 2000 Index Futures Daily Chart Analysis: 2025-Aug-31 18:09 CT
Price Action
- Last: 2375.1,
- Bars: Medium,
- Mom: Momentum average.
WSFG Weekly
- Short-Term
- WSFG Current: 4%
- F0%/NTZ' Bias: Price Above,
- WSFG Trend: Up.
MSFG Month Aug
- Intermediate-Term
- MSFG Current: 107%
- F0%/NTZ' Bias: Price Above,
- MSFG Trend: Up.
YSFG Year 2025
- Long-Term
- YSFG Current: 14%
- F0%/NTZ' Bias: Price Above,
- YSFG Trend: Up.
Swing Pivots
- (Short-Term) 1. Pvt. Trend: UTrend,
- (Intermediate-Term) 2. HiLo Trend: UTrend,
- 3. Pvt. Evolve: Pvt High 2396.4,
- 4. Pvt. Next: Pvt Low 2249.1,
- 5. Levels R: 2396.4, 2348.6, 2322.4,
- 6. Levels S: 2249.1, 2200.0, 2146.8, 2088.4, 2067.1, 1801.5.
Daily Benchmarks
- (Short-Term) 5 Day: 2368 Up Trend,
- (Short-Term) 10 Day: 2343 Up Trend,
- (Intermediate-Term) 20 Day: 2294.7 Up Trend,
- (Intermediate-Term) 55 Day: 2212.7 Up Trend,
- (Long-Term) 100 Day: 2149.4 Up Trend,
- (Long-Term) 200 Day: 2217.2 Up Trend.
Additional Metrics
Recent Trade Signals
- 29 Aug 2025: Short RTY 09-25 @ 2369.2 Signals.USAR.TR120
- 28 Aug 2025: Long RTY 09-25 @ 2390.5 Signals.USAR-WSFG
Overall Rating
- Short-Term: Bullish,
- Intermediate-Term: Bullish,
- Long-Term: Bullish.
Key Insights Summary
The RTY E-mini Russell 2000 is exhibiting a strong bullish structure across all timeframes. Price is trading above all key moving averages, with each benchmark MA in a confirmed uptrend, supporting the ongoing upward momentum. The swing pivot structure shows a clear uptrend in both short- and intermediate-term, with the most recent pivot high at 2396.4 and support levels well below current price, indicating a healthy buffer for potential pullbacks. The ATR and volume metrics suggest moderate volatility and steady participation. Recent trade signals show both long and short activity, but the prevailing technicals favor the upside. The market is in a trend continuation phase, with higher highs and higher lows, and no immediate signs of exhaustion or reversal. This environment is typically characterized by trend-following behavior, with occasional pullbacks being absorbed by underlying support.
Chart Analysis ATS AI Generated: 2025-08-31 18:09 for Informational use only, not trading advice. Terms and Risk Disclosure Copyright © 2025. Algo Trading Systems LLC.
