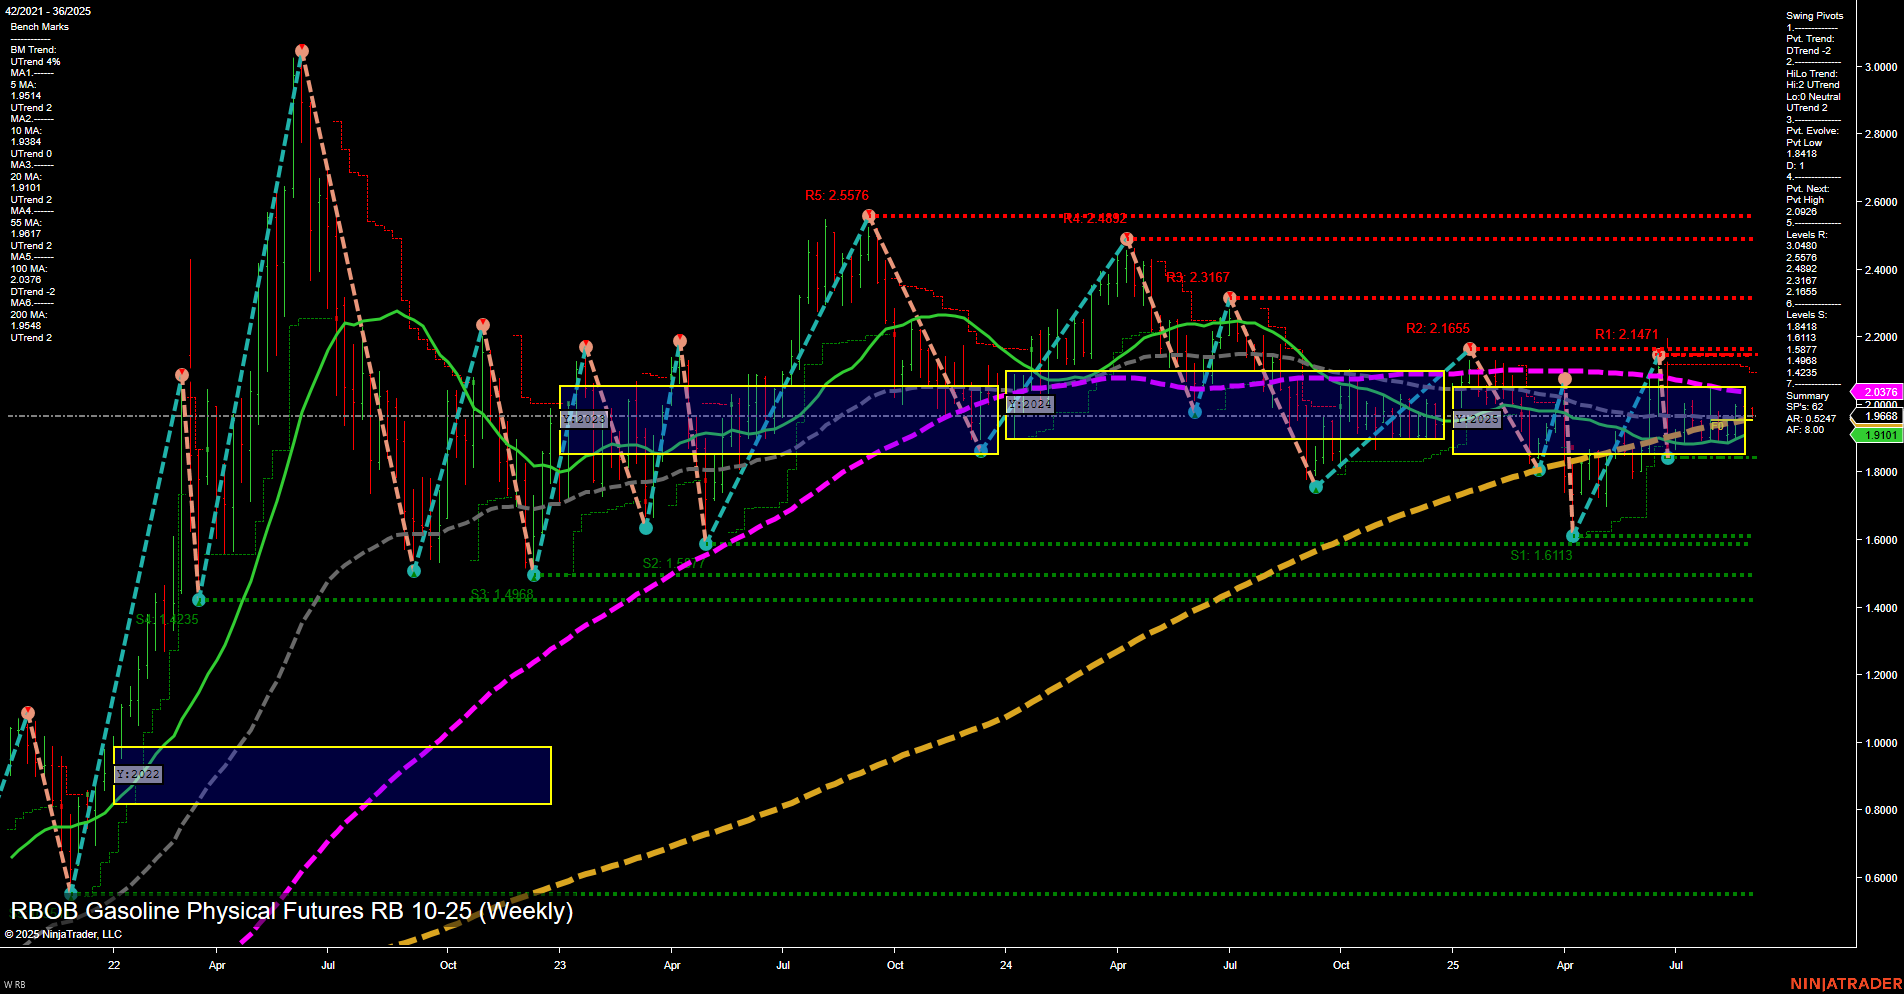
RB RBOB Gasoline Physical Futures Weekly Chart Analysis: 2025-Aug-31 18:08 CT
Price Action
- Last: 1.9968,
- Bars: Medium,
- Mom: Momentum slow.
WSFG Weekly
- Short-Term
- WSFG Current: -2%
- F0%/NTZ' Bias: Price Below,
- WSFG Trend: Down.
MSFG Month Aug
- Intermediate-Term
- MSFG Current: -14%
- F0%/NTZ' Bias: Price Below,
- MSFG Trend: Down.
YSFG Year 2025
- Long-Term
- YSFG Current: 1%
- F0%/NTZ' Bias: Price Above,
- YSFG Trend: Up.
Swing Pivots
- (Short-Term) 1. Pvt. Trend: DTrend,
- (Intermediate-Term) 2. HiLo Trend: UTrend,
- 3. Pvt. Evolve: Pvt Low 1.8418,
- 4. Pvt. Next: Pvt High 2.0248,
- 5. Levels R: 2.5576, 2.4582, 2.3167, 2.1655, 2.1471,
- 6. Levels S: 1.6113, 1.4205, 1.2335.
Weekly Benchmarks
- (Intermediate-Term) 5 Week: 1.9641 Down Trend,
- (Intermediate-Term) 10 Week: 1.9164 Up Trend,
- (Long-Term) 20 Week: 2.0376 Down Trend,
- (Long-Term) 55 Week: 1.9161 Up Trend,
- (Long-Term) 100 Week: 2.0578 Down Trend,
- (Long-Term) 200 Week: 1.9648 Up Trend.
Recent Trade Signals
- 28 Aug 2025: Long RB 10-25 @ 1.9835 Signals.USAR.TR120
- 28 Aug 2025: Short RB 10-25 @ 1.9536 Signals.USAR-MSFG
- 26 Aug 2025: Short RB 10-25 @ 1.9827 Signals.USAR-WSFG
Overall Rating
- Short-Term: Bearish,
- Intermediate-Term: Neutral,
- Long-Term: Neutral.
Key Insights Summary
The RBOB Gasoline futures market is currently exhibiting a mixed technical landscape. Price action is consolidating with medium-sized bars and slow momentum, indicating a lack of strong directional conviction. Short-term (weekly) and intermediate-term (monthly) session fib grid trends are both down, with price trading below their respective NTZ/F0% levels, reinforcing a bearish short-term bias. However, the yearly session fib grid trend remains up, with price just above the annual NTZ, suggesting underlying long-term support.
Swing pivots show a short-term downtrend, but the intermediate-term HiLo trend is up, reflecting a market caught between recent lower highs and higher lows. Key resistance levels are clustered above 2.14, while major support sits well below at 1.61 and 1.42, highlighting a broad trading range. Weekly benchmarks are mixed, with some moving averages trending down and others up, further supporting a neutral to indecisive intermediate and long-term outlook.
Recent trade signals reflect this choppiness, with both long and short entries triggered in close succession. Overall, the market is in a consolidation phase, with no clear breakout or breakdown, and is likely to remain range-bound until a decisive move through key resistance or support levels occurs.
Chart Analysis ATS AI Generated: 2025-08-31 18:09 for Informational use only, not trading advice. Terms and Risk Disclosure Copyright © 2025. Algo Trading Systems LLC.
