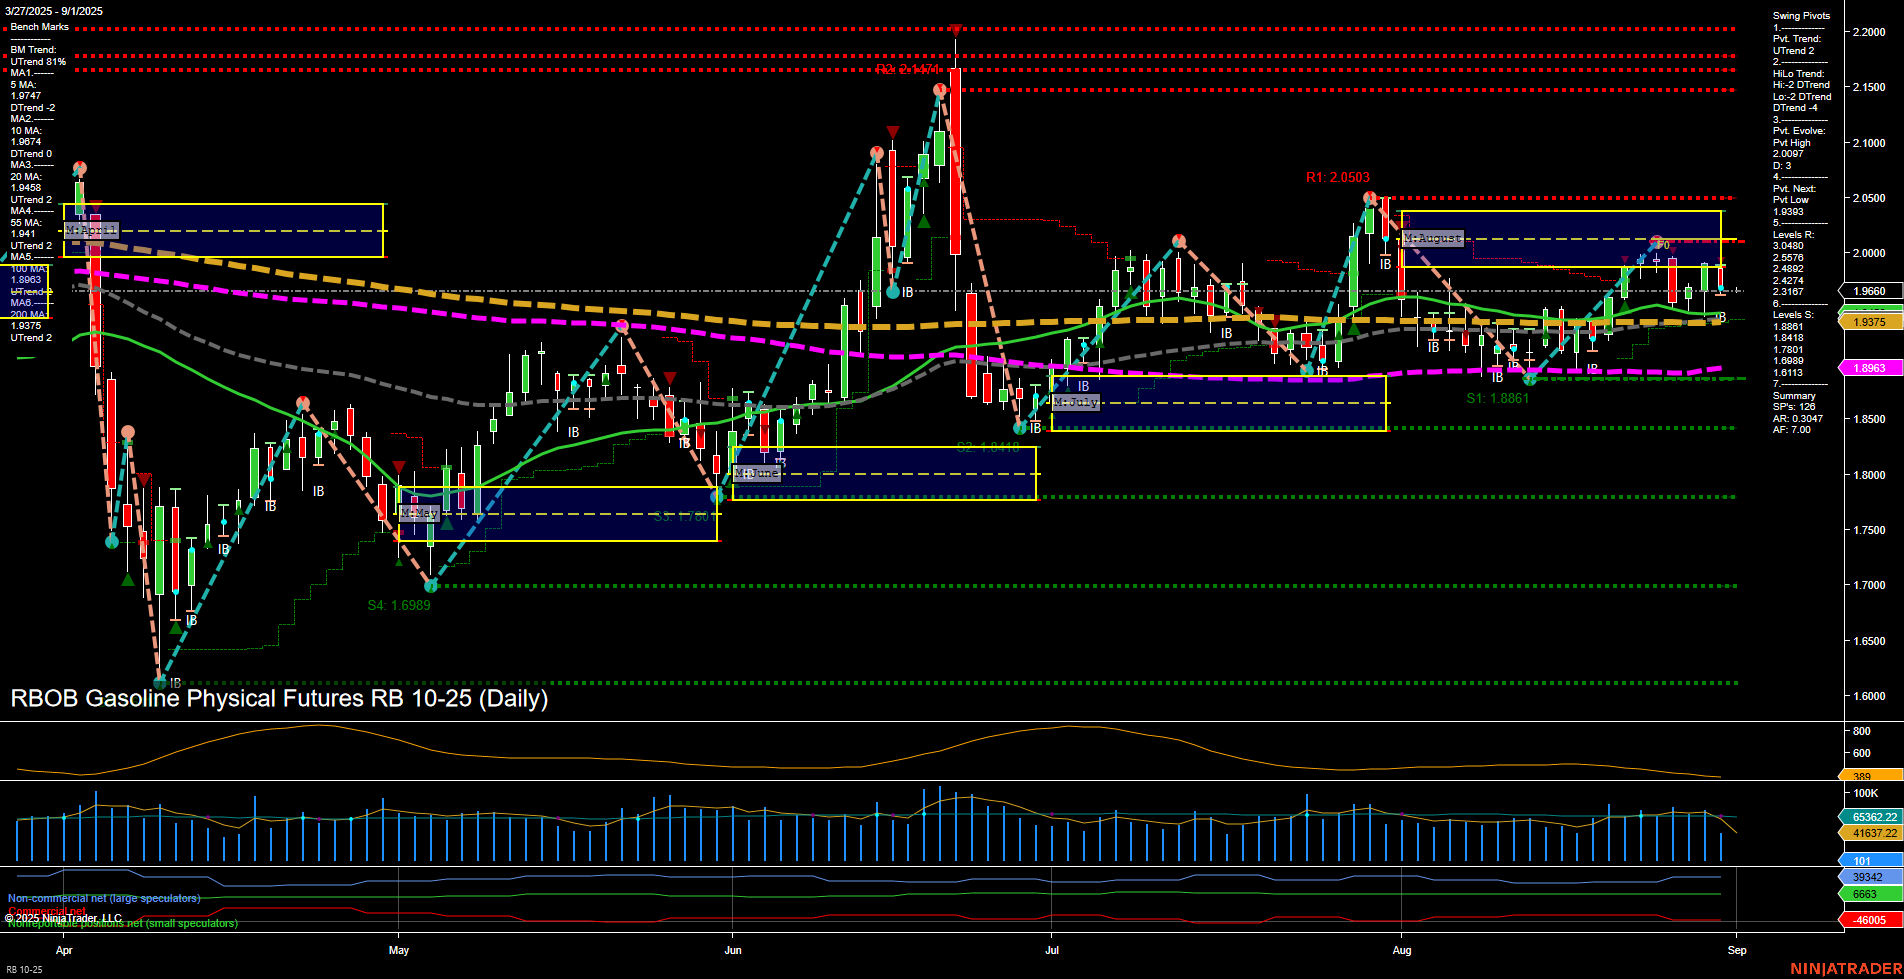
RB RBOB Gasoline Physical Futures Daily Chart Analysis: 2025-Aug-31 18:08 CT
Price Action
- Last: 1.9660,
- Bars: Medium,
- Mom: Momentum average.
WSFG Weekly
- Short-Term
- WSFG Current: -2%
- F0%/NTZ' Bias: Price Below,
- WSFG Trend: Down.
MSFG Month Aug
- Intermediate-Term
- MSFG Current: -14%
- F0%/NTZ' Bias: Price Below,
- MSFG Trend: Down.
YSFG Year 2025
- Long-Term
- YSFG Current: 1%
- F0%/NTZ' Bias: Price Above,
- YSFG Trend: Up.
Swing Pivots
- (Short-Term) 1. Pvt. Trend: DTrend,
- (Intermediate-Term) 2. HiLo Trend: DTrend,
- 3. Pvt. Evolve: Pvt high 2.0507,
- 4. Pvt. Next: Pvt low 1.8861,
- 5. Levels R: 2.0503, 2.0300, 2.0177, 1.9933,
- 6. Levels S: 1.8861, 1.8698, 1.8017, 1.6113.
Daily Benchmarks
- (Short-Term) 5 Day: 1.9741 Down Trend,
- (Short-Term) 10 Day: 1.9874 Down Trend,
- (Intermediate-Term) 20 Day: 1.9966 Down Trend,
- (Intermediate-Term) 55 Day: 1.9397 Up Trend,
- (Long-Term) 100 Day: 1.8963 Up Trend,
- (Long-Term) 200 Day: 1.8808 Up Trend.
Additional Metrics
Recent Trade Signals
- 28 Aug 2025: Long RB 10-25 @ 1.9835 Signals.USAR.TR120
- 28 Aug 2025: Short RB 10-25 @ 1.9536 Signals.USAR-MSFG
- 26 Aug 2025: Short RB 10-25 @ 1.9827 Signals.USAR-WSFG
Overall Rating
- Short-Term: Bearish,
- Intermediate-Term: Bearish,
- Long-Term: Bullish.
Key Insights Summary
The RBOB Gasoline futures market is currently experiencing a short- and intermediate-term downtrend, as indicated by both the WSFG and MSFG trends, with price action below the respective NTZ/F0% levels. The most recent swing pivot structure confirms a downward bias, with the last significant pivot high at 2.0507 and the next potential support pivot at 1.8861. Resistance levels are clustered above 1.99, while support is notably lower, suggesting a wide trading range. Daily moving averages for the short and intermediate term are trending down, reinforcing the bearish tone, while the longer-term averages remain in an uptrend, reflecting underlying strength on a yearly basis. Volatility is moderate (ATR 470), and volume is steady. Recent trade signals show mixed short-term activity, with both long and short entries, but the prevailing technical structure favors a bearish stance in the near term. The market appears to be in a corrective phase within a broader long-term uptrend, with potential for further downside tests before any sustained recovery.
Chart Analysis ATS AI Generated: 2025-08-31 18:08 for Informational use only, not trading advice. Terms and Risk Disclosure Copyright © 2025. Algo Trading Systems LLC.
