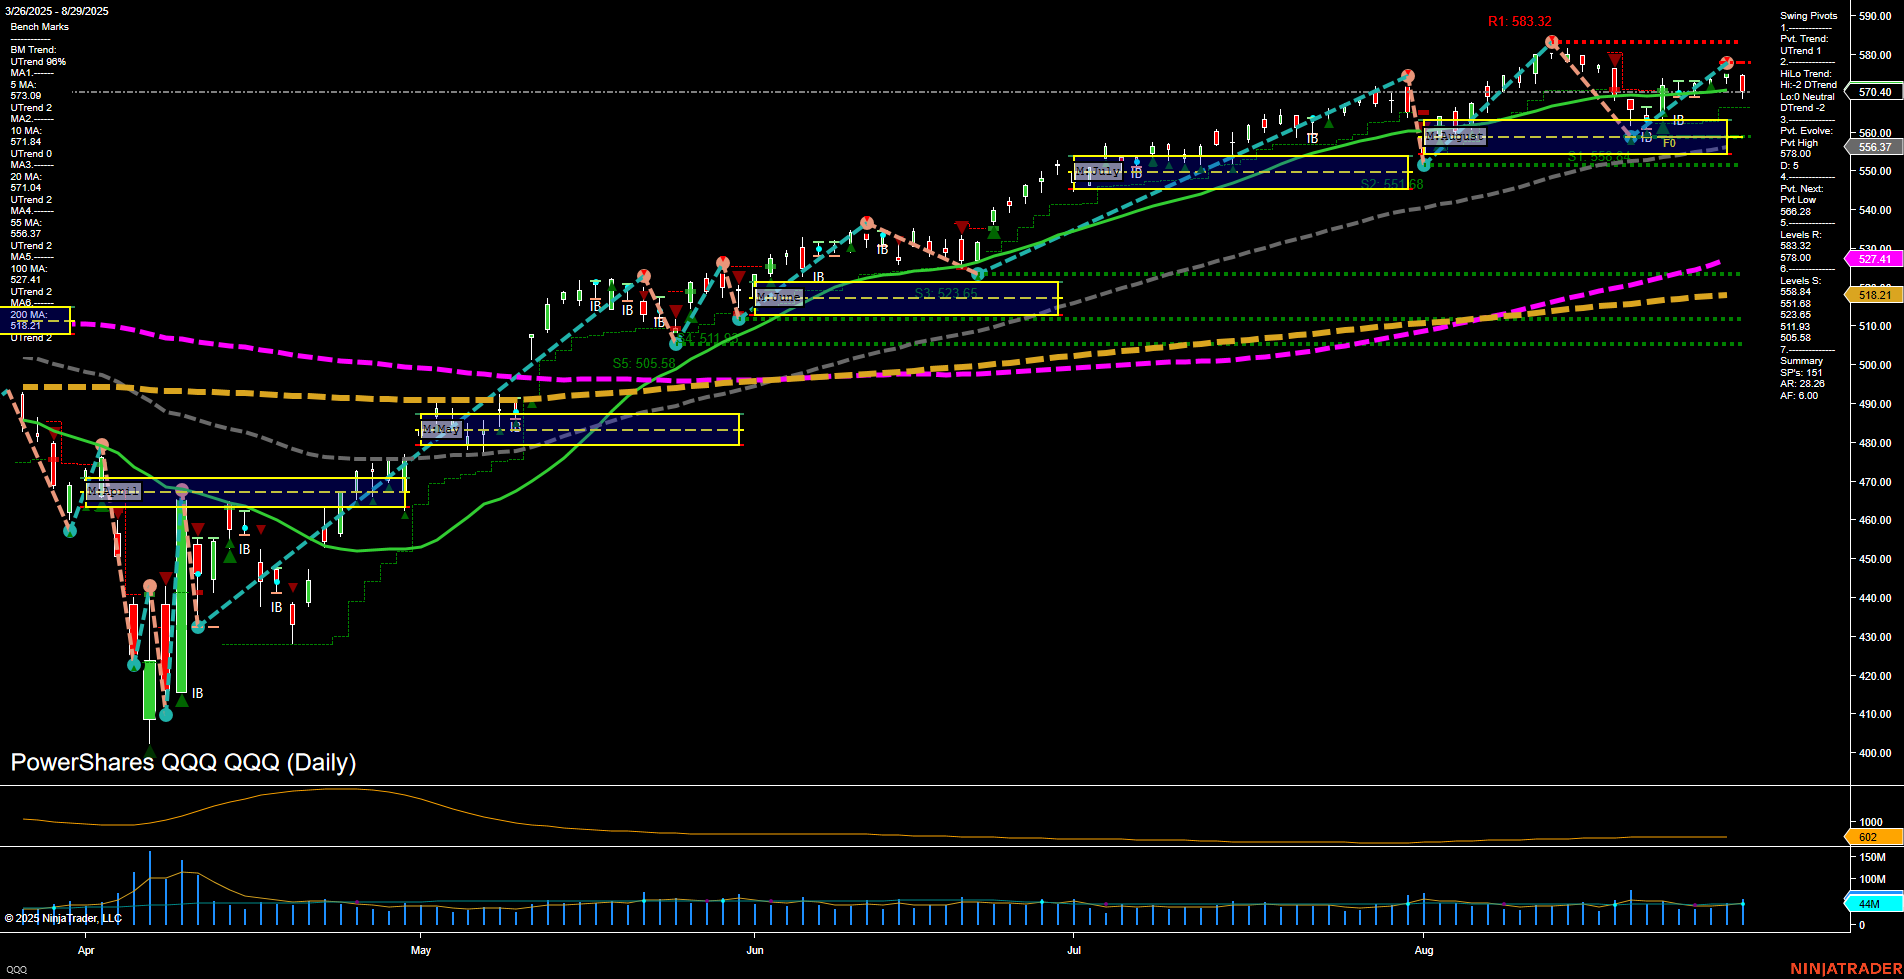
QQQ PowerShares QQQ Daily Chart Analysis: 2025-Aug-31 18:08 CT
Price Action
- Last: 570.40,
- Bars: Medium,
- Mom: Momentum average.
WSFG Weekly
- Short-Term
- WSFG Current: NA%
- F0%/NTZ' Bias: Price Neutral,
- WSFG Trend: Neutral.
MSFG Month Aug
- Intermediate-Term
- MSFG Current: NA%
- F0%/NTZ' Bias: Price Neutral,
- MSFG Trend: Neutral.
YSFG Year 2025
- Long-Term
- YSFG Current: NA%
- F0%/NTZ' Bias: Price Neutral,
- YSFG Trend: Neutral.
Swing Pivots
- (Short-Term) 1. Pvt. Trend: UTrend,
- (Intermediate-Term) 2. HiLo Trend: DTrend,
- 3. Pvt. Evolve: Pvt High 563.32,
- 4. Pvt. Next: Pvt Low 556.37,
- 5. Levels R: 583.32, 578.00, 568.28, 563.32,
- 6. Levels S: 551.86, 551.68, 505.88, 505.58.
Daily Benchmarks
- (Short-Term) 5 Day: 573.00 Up Trend,
- (Short-Term) 10 Day: 571.84 Up Trend,
- (Intermediate-Term) 20 Day: 570.04 Up Trend,
- (Intermediate-Term) 55 Day: 551.74 Up Trend,
- (Long-Term) 100 Day: 527.41 Up Trend,
- (Long-Term) 200 Day: 518.21 Up Trend.
Additional Metrics
- ATR: 28.28,
- VOLMA: 32,709,273.
Overall Rating
- Short-Term: Bullish,
- Intermediate-Term: Neutral,
- Long-Term: Bullish.
Key Insights Summary
The QQQ daily chart shows a strong bullish structure in the short and long term, with all benchmark moving averages trending upward and price holding above key averages. The most recent swing pivot is a high at 563.32, with the next potential pivot low at 556.37, indicating a possible area for short-term pullback or consolidation. Resistance levels are layered above, with 583.32 as the next major upside target, while support is well-defined at 551.86 and lower at 505.88. Momentum is average and price bars are medium, suggesting steady but not explosive movement. The ATR remains elevated, reflecting ongoing volatility, while volume is robust. The intermediate-term trend is neutral, as indicated by the HiLo swing pivot trend, suggesting some consolidation or digestion of recent gains. Overall, the chart reflects a market in a bullish phase with potential for further upside, but with intermediate-term caution as the market consolidates recent advances.
Chart Analysis ATS AI Generated: 2025-08-31 18:08 for Informational use only, not trading advice. Terms and Risk Disclosure Copyright © 2025. Algo Trading Systems LLC.
