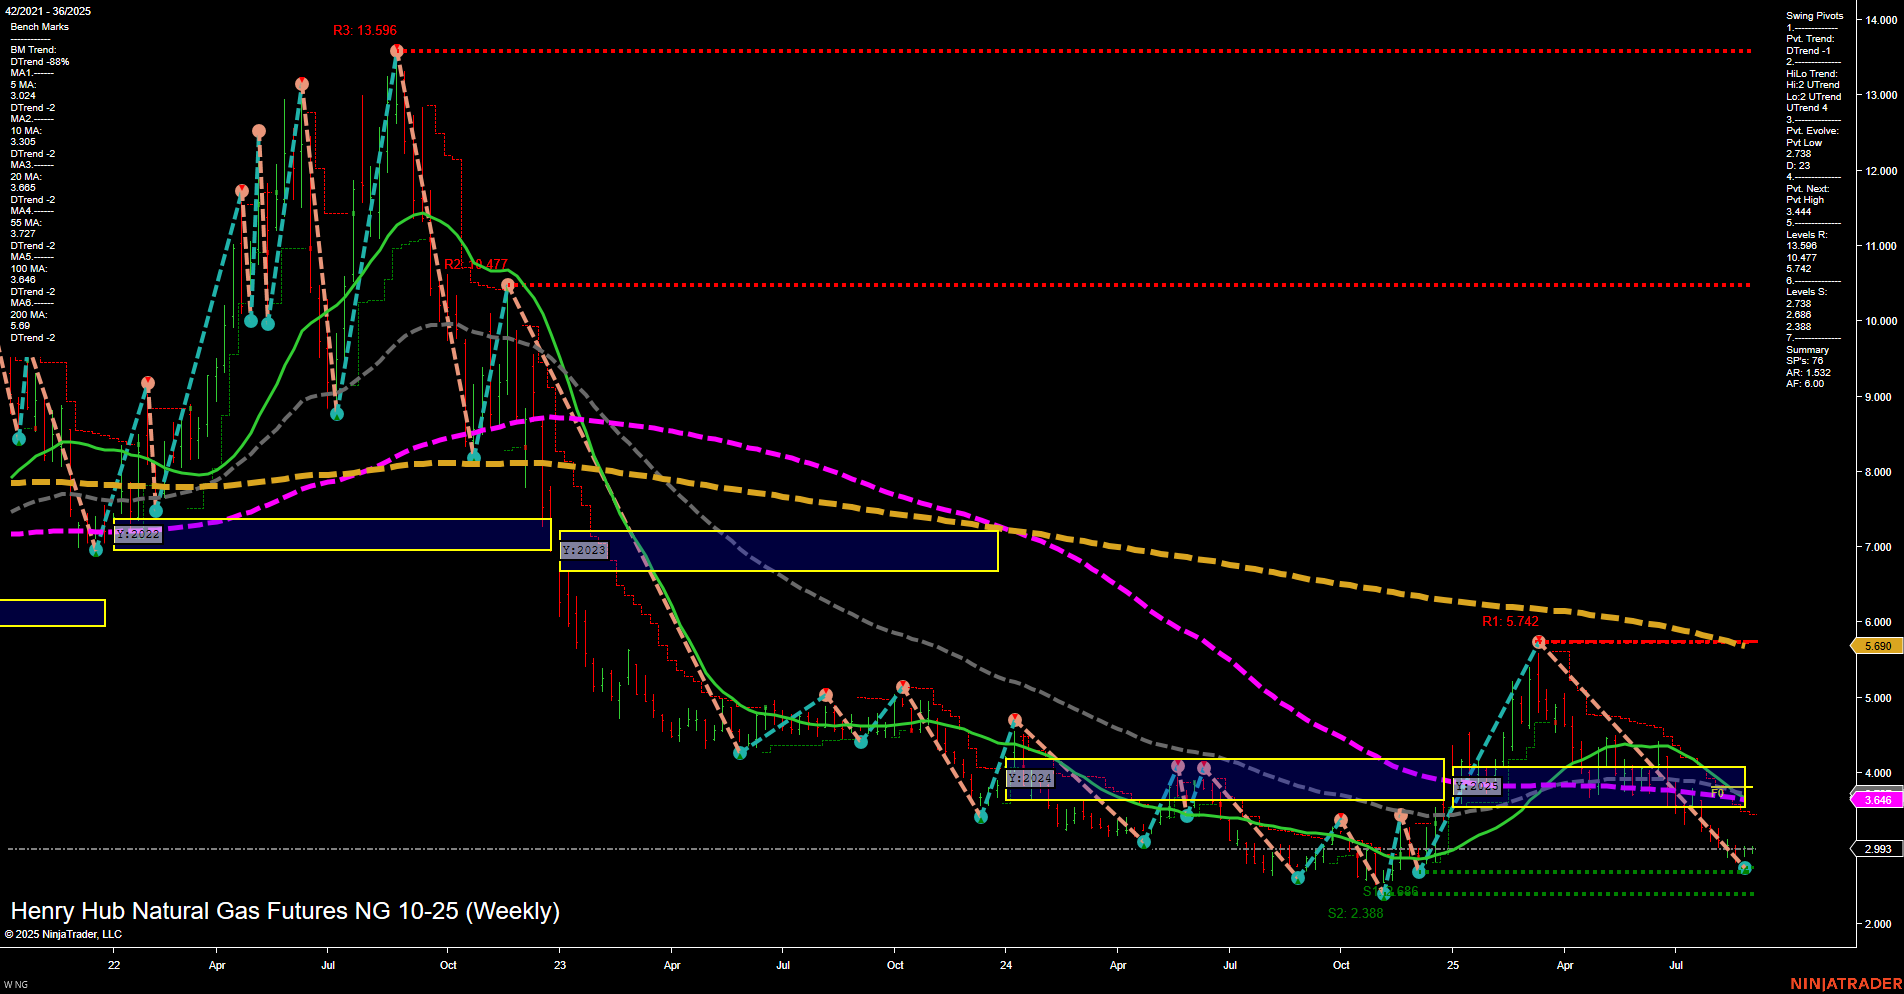
The weekly chart for NG Henry Hub Natural Gas Futures as of late August 2025 shows a market in a prolonged downtrend, with price action currently consolidating near multi-year lows. The last price of 2.993 sits just above key swing support at 2.738 and 2.388, with momentum remaining slow and bars of medium size, indicating a lack of strong directional conviction. All major moving averages (5, 10, 20, 55, 100, 200 week) are trending down, reinforcing the bearish long-term structure. Swing pivot analysis highlights a short-term downtrend, while the intermediate-term HiLo trend is showing early signs of an uptrend, suggesting some potential for a counter-trend bounce or base formation. However, resistance levels remain well overhead, with the nearest significant resistance at 3.44, and much higher at 5.742 and above. The price is currently within a neutral zone on all session fib grids (weekly, monthly, yearly), reflecting a lack of clear directional bias in the short and intermediate term. Overall, the technical landscape is dominated by persistent bearish pressure, with only tentative signs of stabilization. The market is in a consolidation phase near support, and volatility has contracted. Swing traders will note the importance of the 2.738–2.388 support zone for any potential reversal or further breakdown, while upside remains capped by a series of descending resistance levels and declining moving averages. The environment remains challenging for trend-following strategies, with the potential for choppy, range-bound price action until a decisive breakout or breakdown occurs.