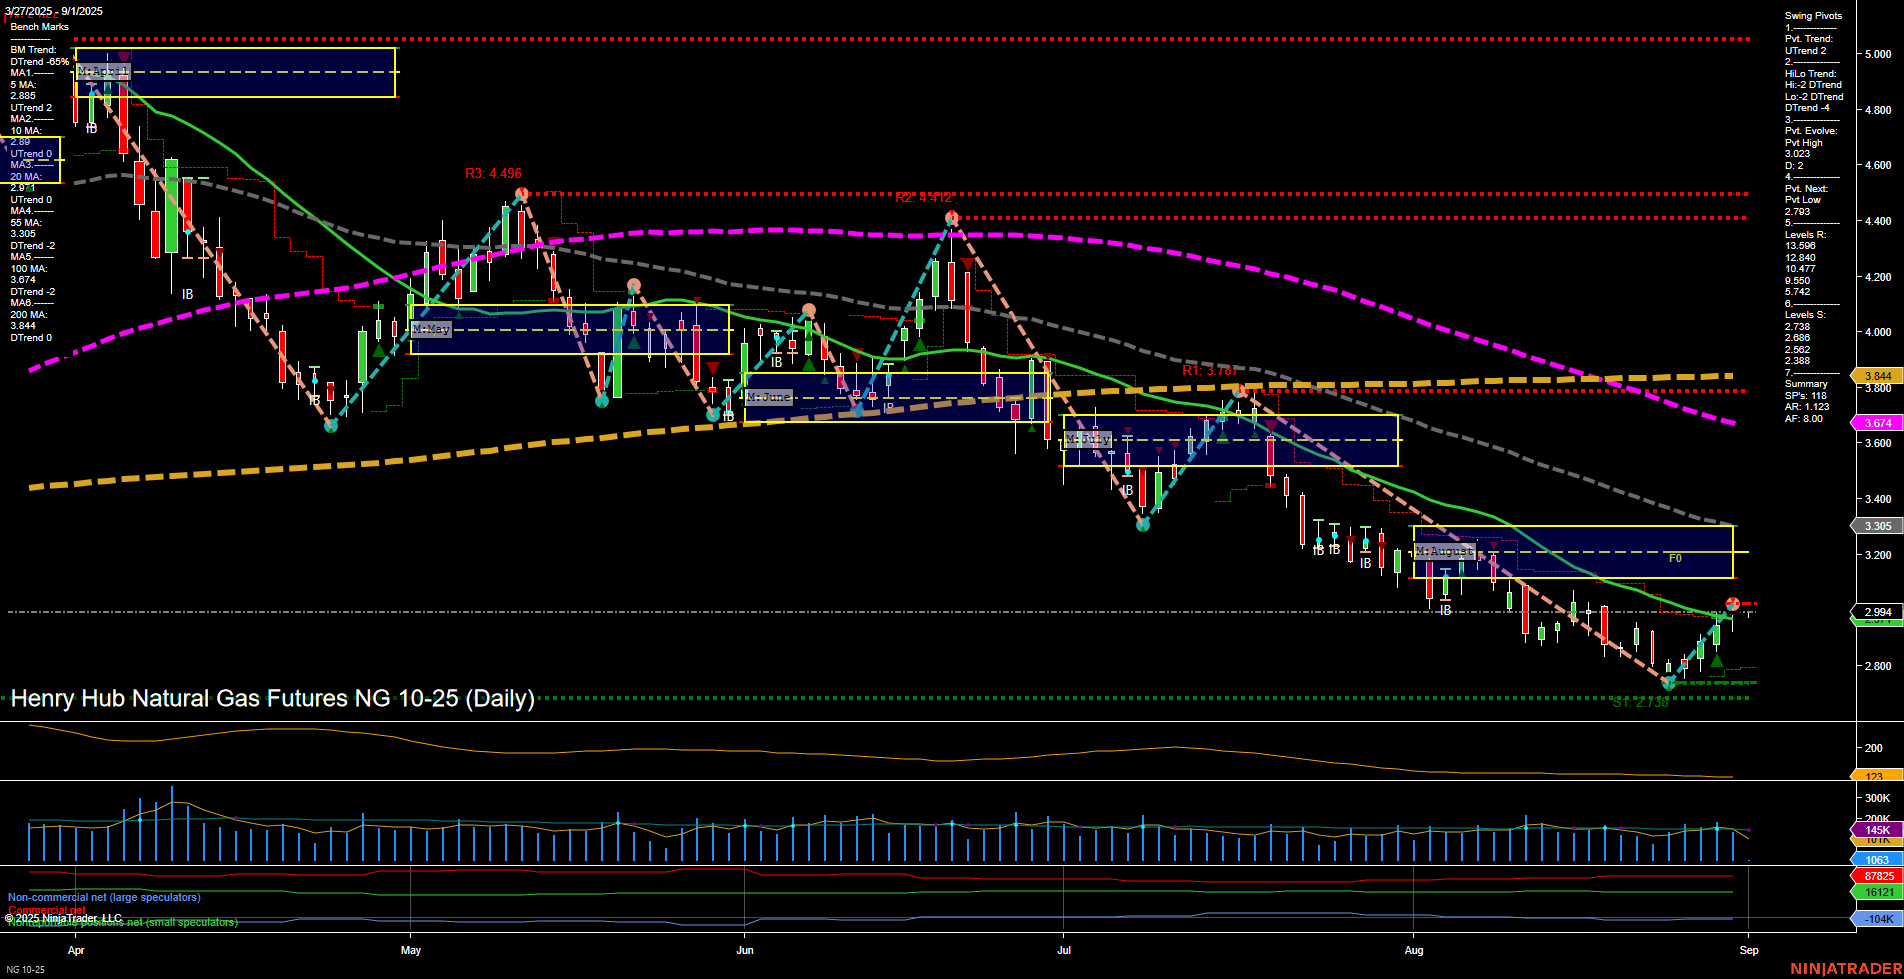
NG Henry Hub Natural Gas Futures Daily Chart Analysis: 2025-Aug-31 18:06 CT
Price Action
- Last: 2.994,
- Bars: Medium,
- Mom: Momentum average.
WSFG Weekly
- Short-Term
- WSFG Current: NA%
- F0%/NTZ' Bias: Price Neutral,
- WSFG Trend: Neutral.
MSFG Month Aug
- Intermediate-Term
- MSFG Current: NA%
- F0%/NTZ' Bias: Price Neutral,
- MSFG Trend: Neutral.
YSFG Year 2025
- Long-Term
- YSFG Current: NA%
- F0%/NTZ' Bias: Price Neutral,
- YSFG Trend: Neutral.
Swing Pivots
- (Short-Term) 1. Pvt. Trend: DTrend,
- (Intermediate-Term) 2. HiLo Trend: DTrend,
- 3. Pvt. Evolve: Pvt high 3.029,
- 4. Pvt. Next: Pvt low 2.788,
- 5. Levels R: 4.496, 4.172, 3.707, 3.360,
- 6. Levels S: 2.788, 2.682, 2.582, 2.388.
Daily Benchmarks
- (Short-Term) 5 Day: 2.885 Down Trend,
- (Short-Term) 10 Day: 2.963 Down Trend,
- (Intermediate-Term) 20 Day: 3.064 Down Trend,
- (Intermediate-Term) 55 Day: 3.384 Down Trend,
- (Long-Term) 100 Day: 3.674 Down Trend,
- (Long-Term) 200 Day: 3.864 Down Trend.
Additional Metrics
Overall Rating
- Short-Term: Bearish,
- Intermediate-Term: Bearish,
- Long-Term: Bearish.
Key Insights Summary
Natural gas futures remain in a pronounced downtrend across all timeframes, as confirmed by both swing pivot structure and the alignment of all benchmark moving averages in persistent downtrends. The most recent price action shows a moderate bounce off recent lows, but momentum remains only average and the price is still trading well below key resistance levels and all major moving averages. The swing pivot summary highlights a dominant DTrend (downtrend) in both short- and intermediate-term, with the next significant support at 2.788 and resistance overhead at 3.360 and higher. The ATR indicates moderate volatility, while volume remains steady but not elevated, suggesting no major shift in participation. Overall, the market is consolidating after a sharp decline, with no clear reversal signals present. The technical landscape suggests continued pressure unless a decisive breakout above resistance and moving averages occurs.
Chart Analysis ATS AI Generated: 2025-08-31 18:07 for Informational use only, not trading advice. Terms and Risk Disclosure Copyright © 2025. Algo Trading Systems LLC.
