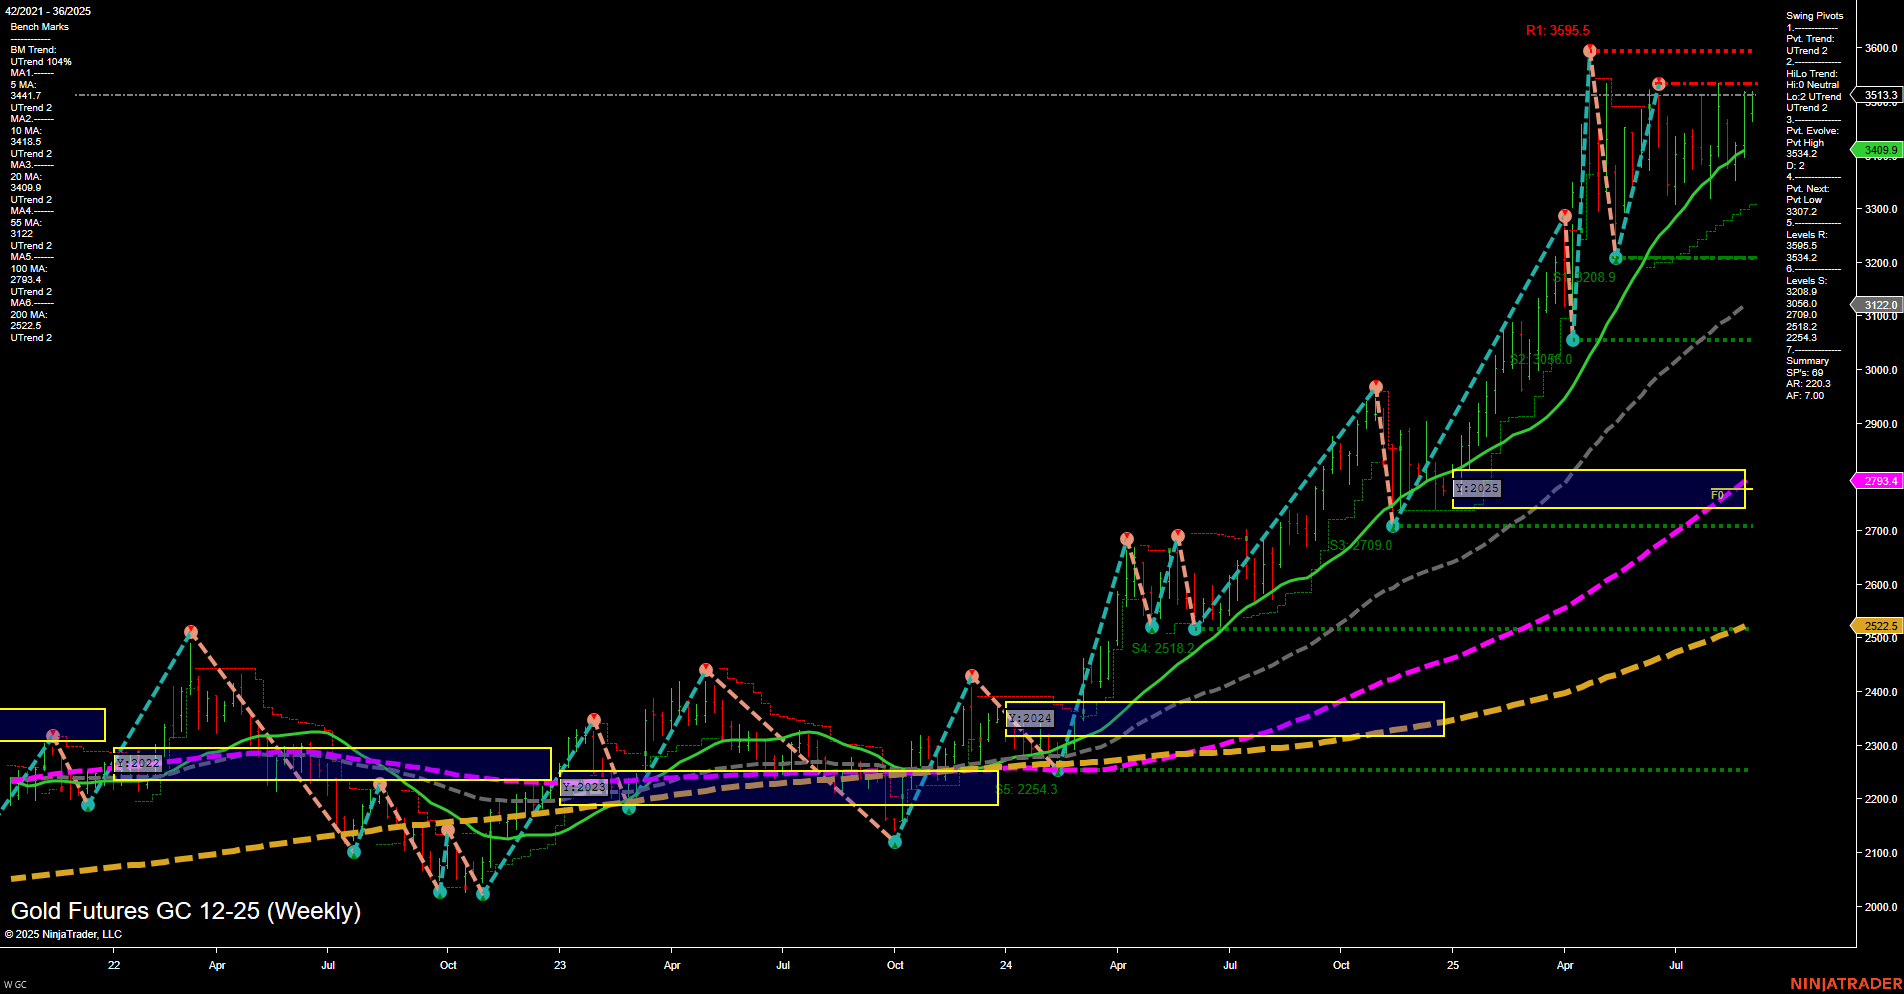
GC Gold Futures Weekly Chart Analysis: 2025-Aug-31 18:06 CT
Price Action
- Last: 3409.9,
- Bars: Medium,
- Mom: Momentum average.
WSFG Weekly
- Short-Term
- WSFG Current: -3%
- F0%/NTZ' Bias: Price Below,
- WSFG Trend: Down.
MSFG Month Aug
- Intermediate-Term
- MSFG Current: 69%
- F0%/NTZ' Bias: Price Above,
- MSFG Trend: Up.
YSFG Year 2025
- Long-Term
- YSFG Current: 205%
- F0%/NTZ' Bias: Price Above,
- YSFG Trend: Up.
Swing Pivots
- (Short-Term) 1. Pvt. Trend: UTrend,
- (Intermediate-Term) 2. HiLo Trend: UTrend,
- 3. Pvt. Evolve: Pvt high 3595.5,
- 4. Pvt. Next: Pvt low 3370.7,
- 5. Levels R: 3595.5, 3534.2, 3513.3, 3508.0, 3200.6,
- 6. Levels S: 3122.0, 2793.4, 2522.5, 2254.3.
Weekly Benchmarks
- (Intermediate-Term) 5 Week: 3441.7 Up Trend,
- (Intermediate-Term) 10 Week: 3418.3 Up Trend,
- (Long-Term) 20 Week: 3409.9 Up Trend,
- (Long-Term) 55 Week: 3122.0 Up Trend,
- (Long-Term) 100 Week: 2793.4 Up Trend,
- (Long-Term) 200 Week: 2522.5 Up Trend.
Recent Trade Signals
- 28 Aug 2025: Long GC 12-25 @ 3465.8 Signals.USAR.TR720
- 27 Aug 2025: Long GC 12-25 @ 3429.8 Signals.USAR-WSFG
Overall Rating
- Short-Term: Neutral,
- Intermediate-Term: Bullish,
- Long-Term: Bullish.
Key Insights Summary
Gold futures continue to show strong long-term and intermediate-term uptrends, supported by all major moving averages trending higher and price action well above key yearly and monthly session fib grid levels. The most recent swing pivots confirm an upward trend, with resistance near the recent high at 3595.5 and support levels well below current price, indicating a wide range for potential retracement. Short-term momentum has slowed, with price currently below the weekly session fib grid NTZ, suggesting some consolidation or a pause after a strong rally. Recent trade signals remain long, reflecting the prevailing bullish bias in the broader trend. The market is in a phase of digestion after a significant move, with the potential for further upside if resistance is cleared, but also room for a pullback toward intermediate support if short-term weakness persists.
Chart Analysis ATS AI Generated: 2025-08-31 18:06 for Informational use only, not trading advice. Terms and Risk Disclosure Copyright © 2025. Algo Trading Systems LLC.
