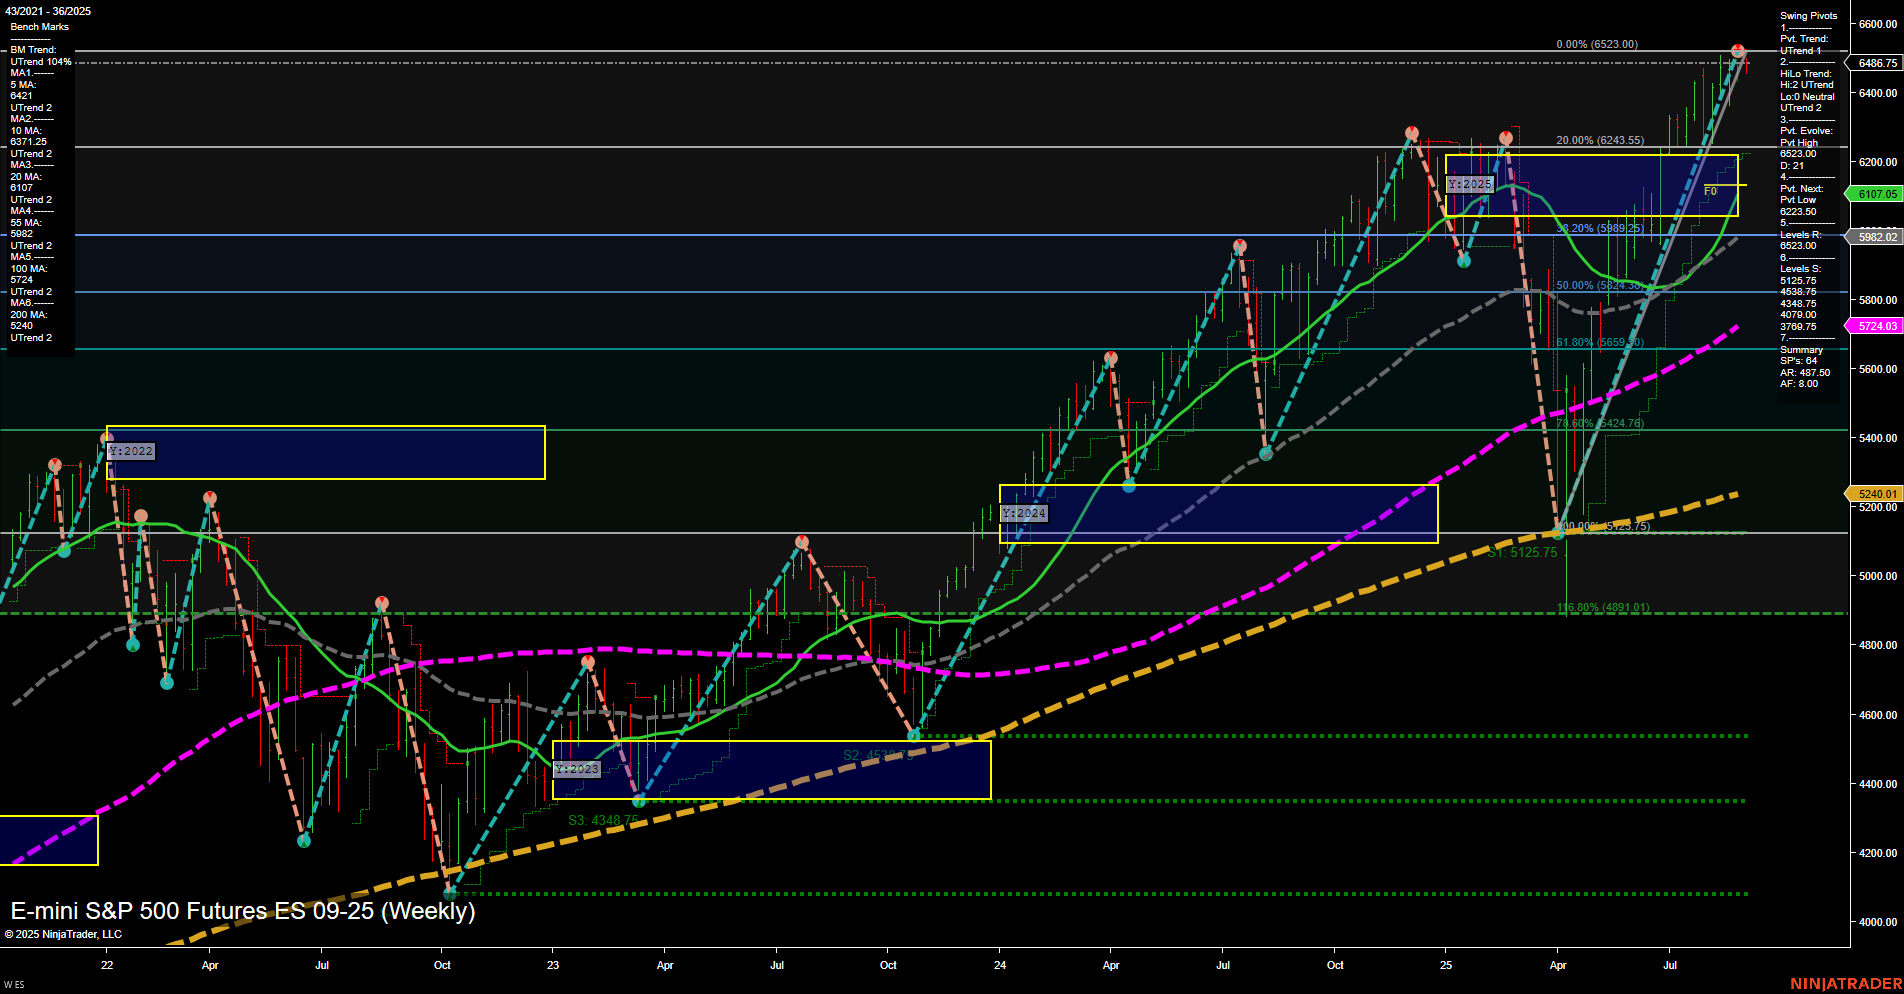
ES E-mini S&P 500 Futures Weekly Chart Analysis: 2025-Aug-31 18:04 CT
Price Action
- Last: 6486.75,
- Bars: Large,
- Mom: Momentum fast.
WSFG Weekly
- Short-Term
- WSFG Current: 10%
- F0%/NTZ' Bias: Price Above,
- WSFG Trend: Up.
MSFG Month Aug
- Intermediate-Term
- MSFG Current: 37%
- F0%/NTZ' Bias: Price Above,
- MSFG Trend: Up.
YSFG Year 2025
- Long-Term
- YSFG Current: 40%
- F0%/NTZ' Bias: Price Above,
- YSFG Trend: Up.
Swing Pivots
- (Short-Term) 1. Pvt. Trend: UTrend,
- (Intermediate-Term) 2. HiLo Trend: UTrend,
- 3. Pvt. Evolve: Pvt high 6486.75,
- 4. Pvt. Next: Pvt low 6107.05,
- 5. Levels R: 6486.75, 6523.00, 6243.55,
- 6. Levels S: 6107.05, 5743.03, 5240.01.
Weekly Benchmarks
- (Intermediate-Term) 5 Week: 6421 Up Trend,
- (Intermediate-Term) 10 Week: 6171.25 Up Trend,
- (Long-Term) 20 Week: 6107 Up Trend,
- (Long-Term) 55 Week: 5544 Up Trend,
- (Long-Term) 100 Week: 5242 Up Trend,
- (Long-Term) 200 Week: 5240 Up Trend.
Recent Trade Signals
- 29 Aug 2025: Short ES 09-25 @ 6462 Signals.USAR.TR120
- 29 Aug 2025: Short ES 09-25 @ 6462.5 Signals.USAR-WSFG
Overall Rating
- Short-Term: Neutral,
- Intermediate-Term: Bullish,
- Long-Term: Bullish.
Key Insights Summary
The ES E-mini S&P 500 Futures weekly chart shows a strong upward trend across all major timeframes, with price action making new highs and momentum remaining fast. The market is trading well above all key moving averages, which are all trending higher, confirming the strength of the long-term uptrend. Swing pivots indicate the most recent move is a pivot high, with the next significant support at 6107.05. Despite the strong bullish structure, recent short-term trade signals suggest some potential for a short-term pullback or consolidation after a large, fast move. The overall structure remains constructive, with higher lows and higher highs, and no major signs of trend exhaustion on the intermediate or long-term horizon. The market is currently in a phase where short-term volatility and possible retracement could occur, but the broader trend remains intact.
Chart Analysis ATS AI Generated: 2025-08-31 18:04 for Informational use only, not trading advice. Terms and Risk Disclosure Copyright © 2025. Algo Trading Systems LLC.
