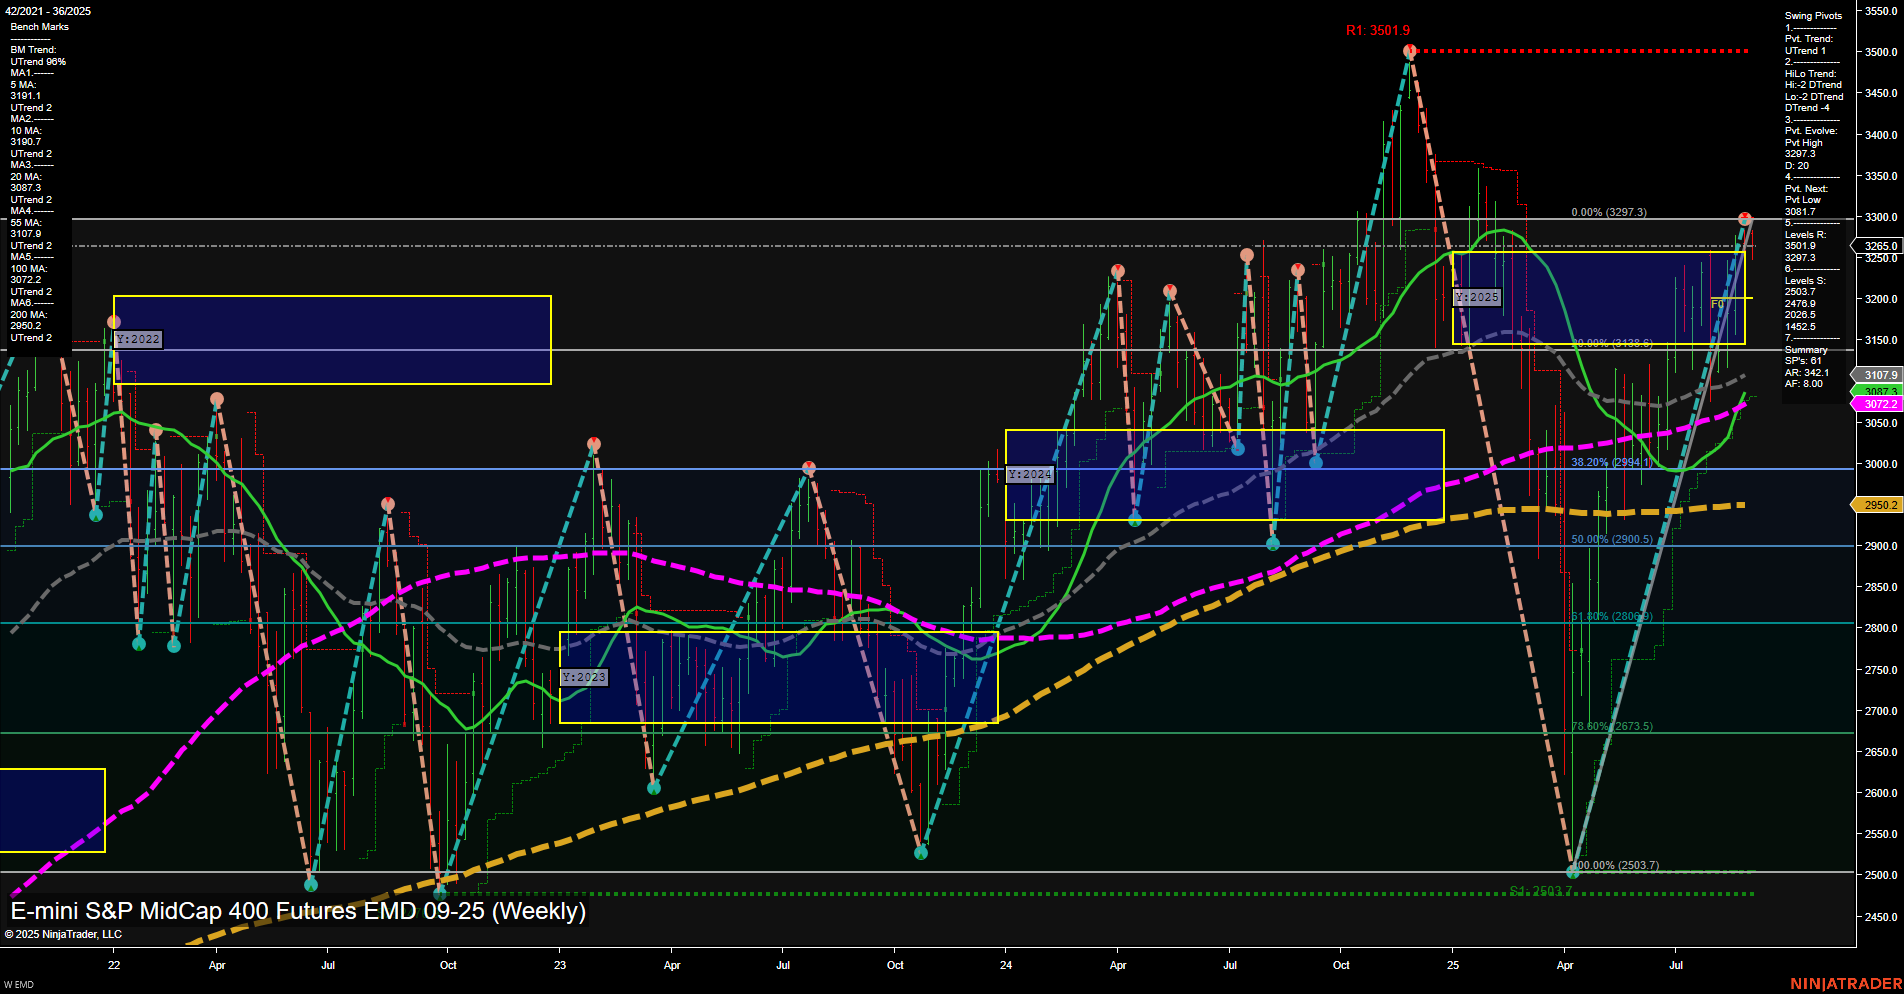
EMD E-mini S&P MidCap 400 Futures Weekly Chart Analysis: 2025-Aug-31 18:03 CT
Price Action
- Last: 3257,
- Bars: Large,
- Mom: Momentum fast.
WSFG Weekly
- Short-Term
- WSFG Current: -1%
- F0%/NTZ' Bias: Price Below,
- WSFG Trend: Down.
MSFG Month Aug
- Intermediate-Term
- MSFG Current: 57%
- F0%/NTZ' Bias: Price Above,
- MSFG Trend: Up.
YSFG Year 2025
- Long-Term
- YSFG Current: 11%
- F0%/NTZ' Bias: Price Above,
- YSFG Trend: Up.
Swing Pivots
- (Short-Term) 1. Pvt. Trend: UTrend,
- (Intermediate-Term) 2. HiLo Trend: UTrend,
- 3. Pvt. Evolve: Pvt high 3297.3,
- 4. Pvt. Next: Pvt low 3041.7,
- 5. Levels R: 3501.9, 3297.3,
- 6. Levels S: 3041.7, 2673.5.
Weekly Benchmarks
- (Intermediate-Term) 5 Week: 3170.7 Up Trend,
- (Intermediate-Term) 10 Week: 3101.1 Up Trend,
- (Long-Term) 20 Week: 3072.2 Up Trend,
- (Long-Term) 55 Week: 3072.2 Up Trend,
- (Long-Term) 100 Week: 3072.2 Up Trend,
- (Long-Term) 200 Week: 2950.2 Up Trend.
Recent Trade Signals
- 29 Aug 2025: Short EMD 09-25 @ 3256.4 Signals.USAR.TR120
- 29 Aug 2025: Short EMD 09-25 @ 3253.1 Signals.USAR-WSFG
Overall Rating
- Short-Term: Bearish,
- Intermediate-Term: Bullish,
- Long-Term: Bullish.
Key Insights Summary
The EMD futures weekly chart shows a strong recovery from the spring lows, with price action characterized by large, fast-moving bars and a recent test of major resistance at 3297.3. While the short-term WSFG trend has turned down with price slipping below the NTZ, the intermediate and long-term trends remain firmly bullish, supported by all key moving averages trending higher and price holding well above the 200-week benchmark. Swing pivots confirm an uptrend in both short- and intermediate-term structures, but the latest trade signals indicate a short-term pullback or correction is underway after a sharp rally. The market is currently consolidating just below resistance, with support levels at 3041.7 and 2673.5 in focus if the pullback deepens. Overall, the structure suggests a bullish bias for the medium and long term, but with short-term volatility and potential for further retracement before any renewed advance.
Chart Analysis ATS AI Generated: 2025-08-31 18:04 for Informational use only, not trading advice. Terms and Risk Disclosure Copyright © 2025. Algo Trading Systems LLC.
