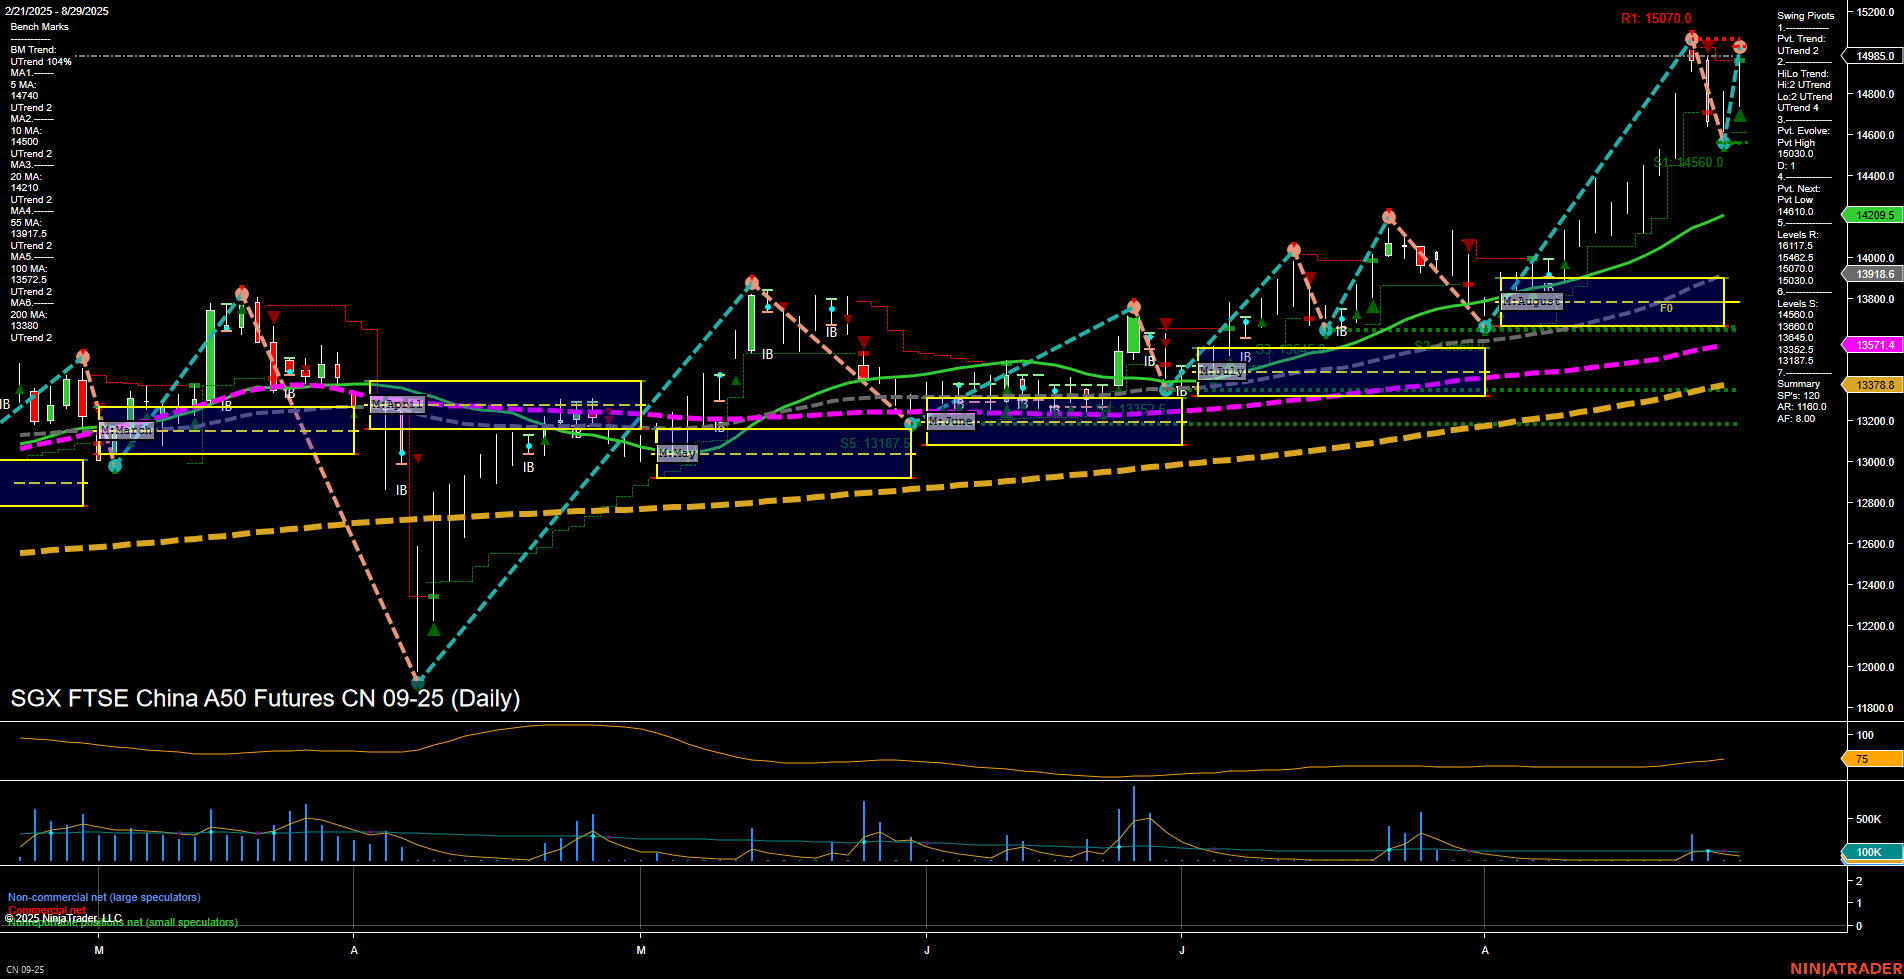
CN SGX FTSE China A50 Futures Daily Chart Analysis: 2025-Aug-31 18:03 CT
Price Action
- Last: 14985.0,
- Bars: Large,
- Mom: Momentum fast.
WSFG Weekly
- Short-Term
- WSFG Current: NA%
- F0%/NTZ' Bias: Price Neutral,
- WSFG Trend: Neutral.
MSFG Month Aug
- Intermediate-Term
- MSFG Current: NA%
- F0%/NTZ' Bias: Price Neutral,
- MSFG Trend: Neutral.
YSFG Year 2025
- Long-Term
- YSFG Current: NA%
- F0%/NTZ' Bias: Price Neutral,
- YSFG Trend: Neutral.
Swing Pivots
- (Short-Term) 1. Pvt. Trend: UTrend,
- (Intermediate-Term) 2. HiLo Trend: UTrend,
- 3. Pvt. Evolve: Pvt High 15030.0,
- 4. Pvt. Next: Pvt Low 14560.0,
- 5. Levels R: 15070.0,
- 6. Levels S: 14560.0, 13918.6, 13571.4, 13378.8.
Daily Benchmarks
- (Short-Term) 5 Day: 14740 Up Trend,
- (Short-Term) 10 Day: 14500 Up Trend,
- (Intermediate-Term) 20 Day: 14209.5 Up Trend,
- (Intermediate-Term) 55 Day: 13918.6 Up Trend,
- (Long-Term) 100 Day: 13571.4 Up Trend,
- (Long-Term) 200 Day: 13378.8 Up Trend.
Additional Metrics
Overall Rating
- Short-Term: Bullish,
- Intermediate-Term: Bullish,
- Long-Term: Bullish.
Key Insights Summary
The CN SGX FTSE China A50 Futures daily chart shows a strong bullish structure across all timeframes. Price has recently made a large, fast momentum move to new highs, with the last price at 14985.0, just below the recent swing high resistance at 15070.0. All benchmark moving averages (from 5-day to 200-day) are trending upward, confirming broad-based strength and trend alignment. Swing pivot analysis indicates an ongoing uptrend, with the next key support at 14560.0 and further supports layered below, suggesting a healthy trend with multiple levels for potential pullbacks. Volatility, as measured by ATR, is elevated, and volume remains robust, supporting the recent breakout. The market is in a clear trend continuation phase, with higher highs and higher lows, and no immediate signs of reversal or exhaustion. The overall technical environment favors trend-following strategies, with the market currently consolidating just below resistance after a strong rally.
Chart Analysis ATS AI Generated: 2025-08-31 18:03 for Informational use only, not trading advice. Terms and Risk Disclosure Copyright © 2025. Algo Trading Systems LLC.
