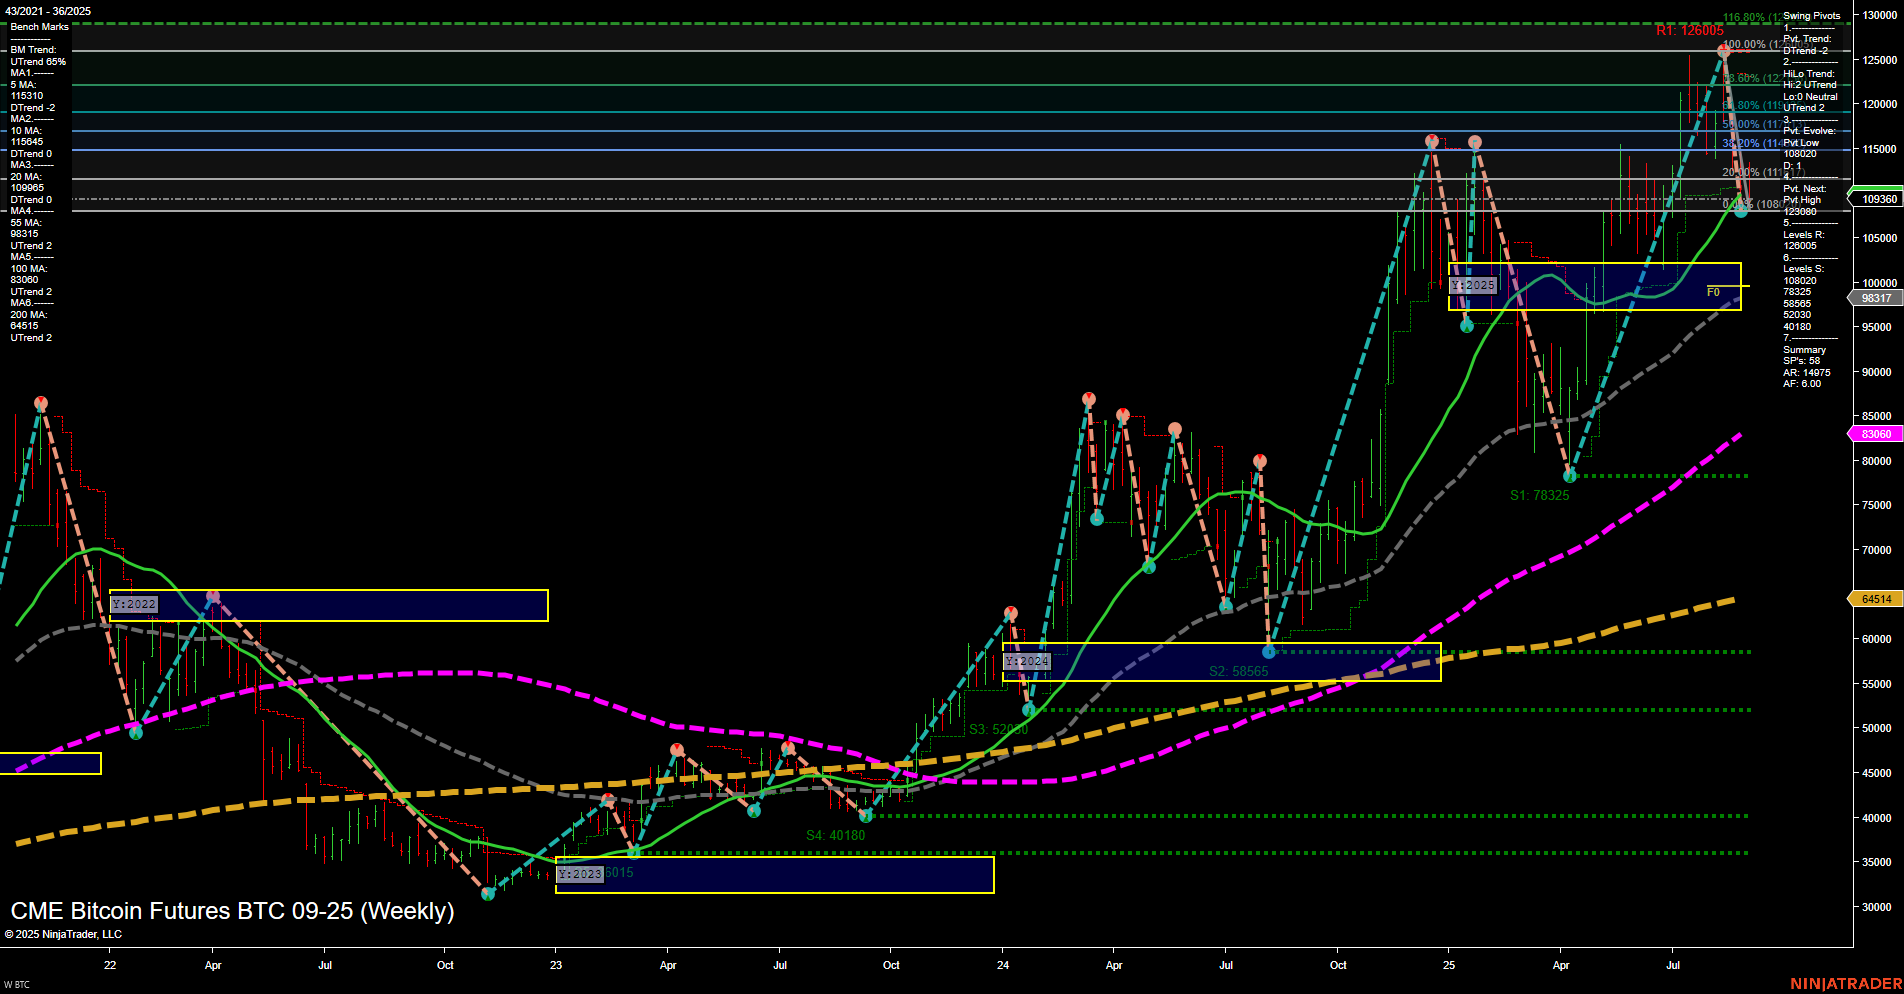
BTC CME Bitcoin Futures Weekly Chart Analysis: 2025-Aug-31 18:02 CT
Price Action
- Last: 109360,
- Bars: Large,
- Mom: Momentum fast.
WSFG Weekly
- Short-Term
- WSFG Current: 19%
- F0%/NTZ' Bias: Price Above,
- WSFG Trend: Up.
MSFG Month Aug
- Intermediate-Term
- MSFG Current: -45%
- F0%/NTZ' Bias: Price Below,
- MSFG Trend: Down.
YSFG Year 2025
- Long-Term
- YSFG Current: 37%
- F0%/NTZ' Bias: Price Above,
- YSFG Trend: Up.
Swing Pivots
- (Short-Term) 1. Pvt. Trend: DTrend,
- (Intermediate-Term) 2. HiLo Trend: UTrend,
- 3. Pvt. Evolve: Pvt high 126005,
- 4. Pvt. Next: Pvt high 126005,
- 5. Levels R: 126005, 120800, 115310, 113200, 111000, 109800,
- 6. Levels S: 98317, 78325, 58665, 52900, 40180.
Weekly Benchmarks
- (Intermediate-Term) 5 Week: 115310 Down Trend,
- (Intermediate-Term) 10 Week: 113200 Down Trend,
- (Long-Term) 20 Week: 109800 Up Trend,
- (Long-Term) 55 Week: 83500 Up Trend,
- (Long-Term) 100 Week: 64514 Up Trend,
- (Long-Term) 200 Week: 40180 Up Trend.
Overall Rating
- Short-Term: Neutral,
- Intermediate-Term: Bullish,
- Long-Term: Bullish.
Key Insights Summary
BTC CME Futures are exhibiting strong volatility with large weekly bars and fast momentum, reflecting a dynamic market environment. The short-term trend is neutralizing after a sharp move, as indicated by a downtrend in the most recent swing pivot but an overall uptrend in the weekly session fib grid. Intermediate-term structure remains bullish, supported by a clear uptrend in the HiLo swing pivots and a series of higher support levels. Long-term outlook is robustly bullish, with price holding well above all major moving averages and the yearly session fib grid trending up. Resistance is clustered near recent highs (126005–109800), while support is well-defined at lower levels (98317 and below), suggesting a wide trading range. The market appears to be in a consolidation phase after a strong rally, with potential for further upside if resistance levels are breached, but also room for corrective pullbacks toward major support if momentum fades. Overall, the technical structure favors a bullish bias for intermediate and long-term swing traders, while short-term traders may see choppy or range-bound action as the market digests recent gains.
Chart Analysis ATS AI Generated: 2025-08-31 18:02 for Informational use only, not trading advice. Terms and Risk Disclosure Copyright © 2025. Algo Trading Systems LLC.
