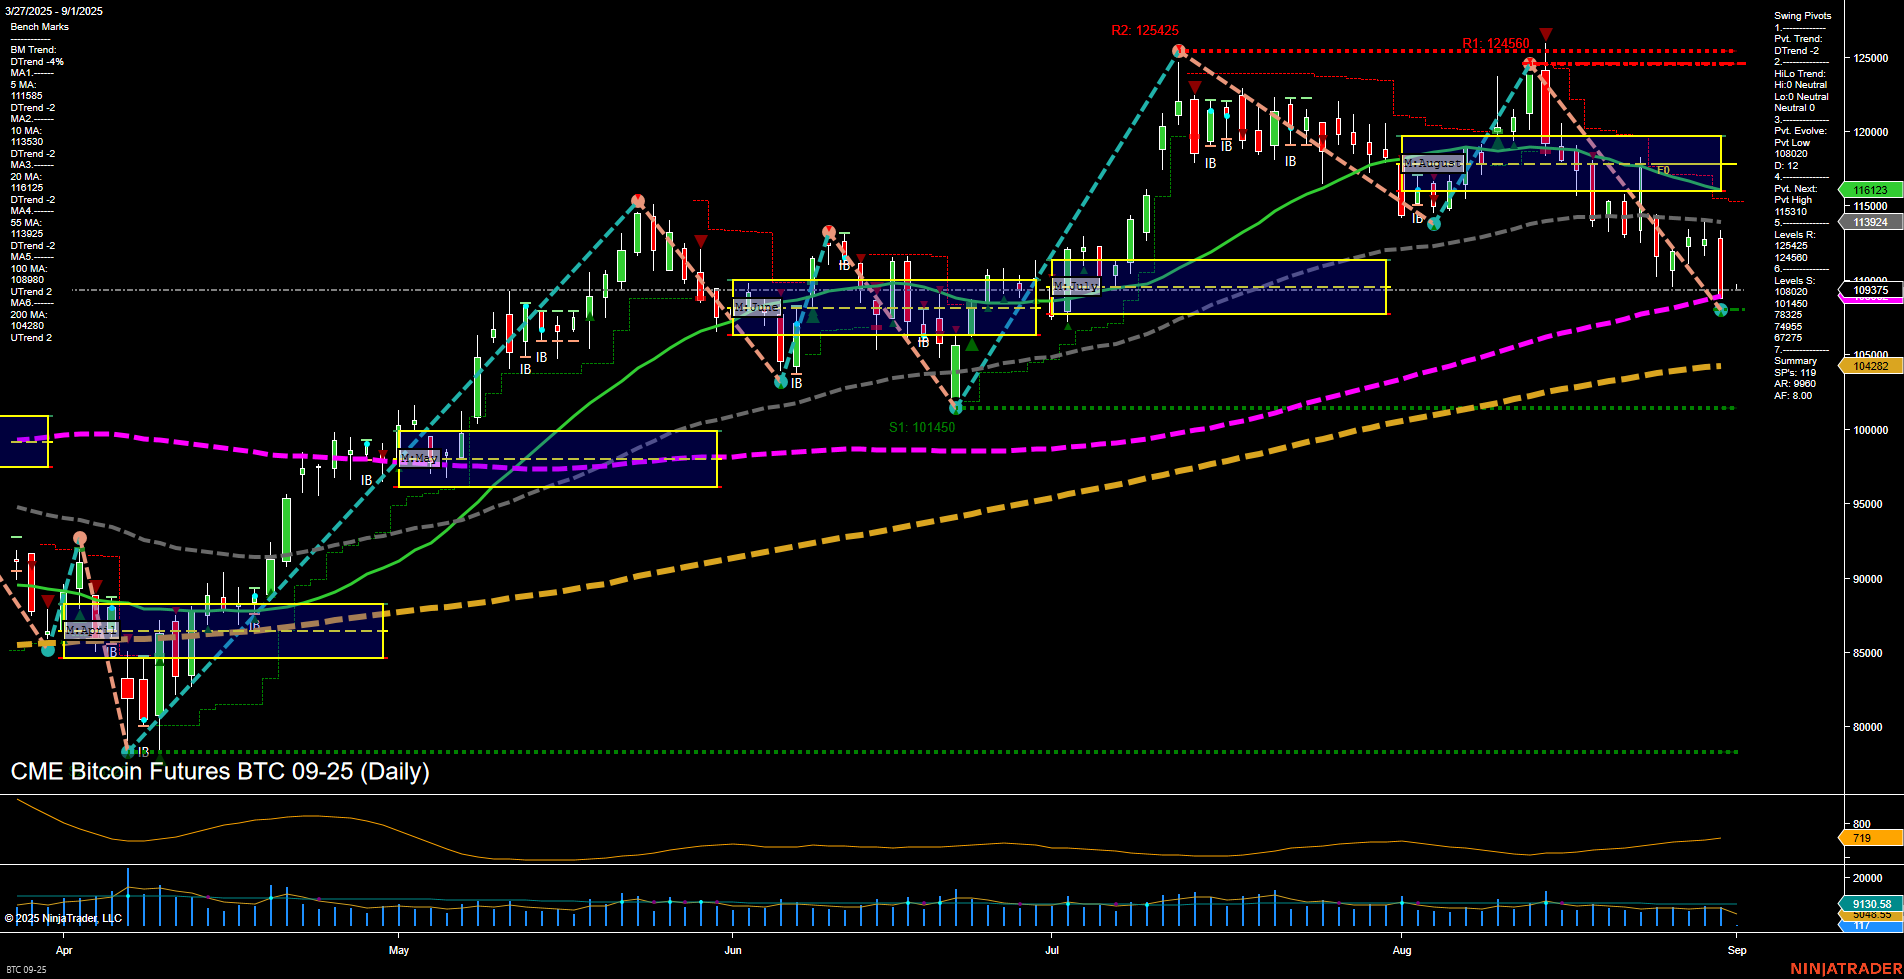
BTC CME Bitcoin Futures are currently experiencing a corrective phase, with price action showing a slow momentum and medium-sized bars, indicating a lack of strong directional conviction. The short-term and intermediate-term trends are both down, as confirmed by the swing pivot structure and all key moving averages (except the 200-day) trending lower. Price is trading below the monthly session fib grid (MSFG) neutral zone, reinforcing the intermediate-term bearish bias, while the weekly and yearly session fib grids remain above their respective neutral zones, suggesting underlying long-term support. Resistance levels are clustered above at 113924, 115900, and 124650, while support is found at 108020 and further below at 101450. The 200-day moving average is still trending up, which tempers the long-term outlook to neutral rather than outright bearish. Volatility (ATR) is moderate, and volume remains steady. The market appears to be in a retracement or consolidation phase after a prior rally, with the potential for further downside tests before any significant recovery. Swing traders may observe for signs of a base or reversal at key support levels, but the prevailing structure currently favors a cautious stance until a clear shift in momentum or trend emerges.