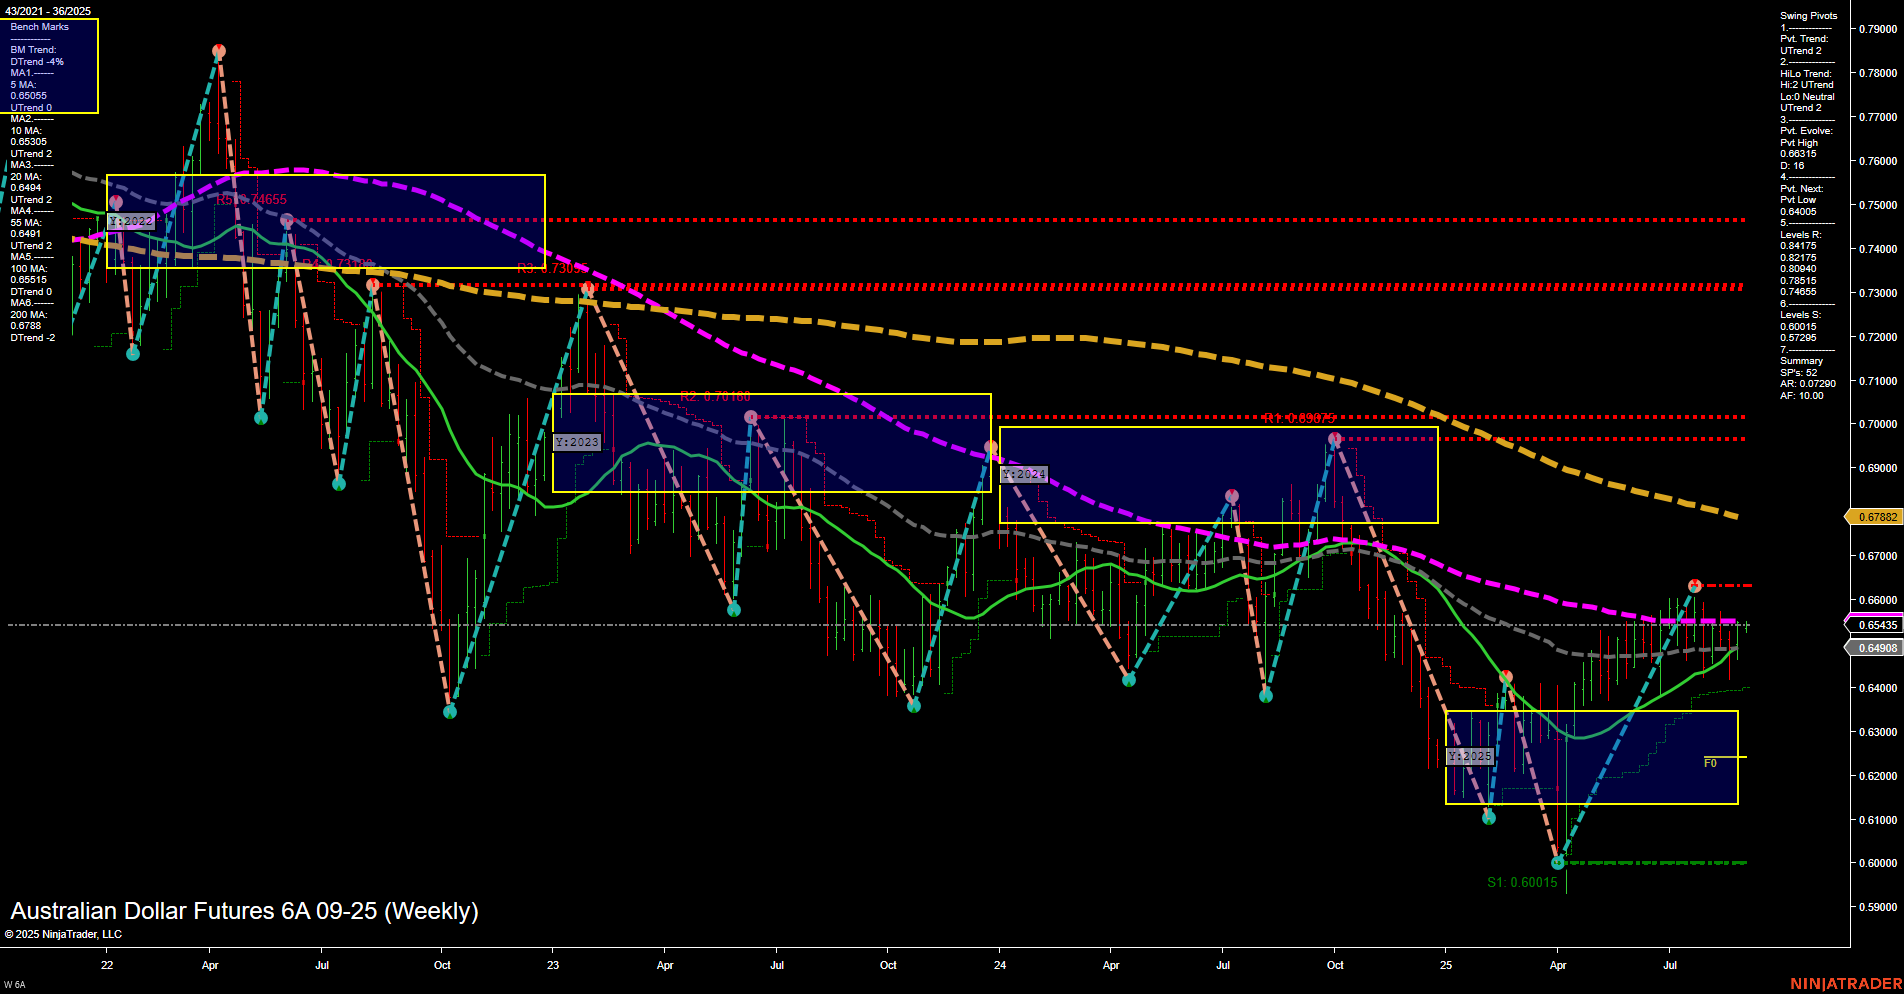
The 6A Australian Dollar Futures weekly chart shows a market in recovery mode after a significant downtrend, with recent price action forming a series of higher lows and higher highs. The short- and intermediate-term swing pivot trends have shifted to uptrends, supported by the 5, 10, and 20-week moving averages all turning upward. However, the long-term moving averages (55, 100, and 200 week) remain in a downtrend, indicating that the broader bearish structure is not yet fully reversed. Price is currently testing a key resistance cluster around 0.65435–0.66015, with further resistance at 0.66755 and 0.68075. The only major support level below is at 0.60015, the most recent swing low. The neutral bias across the session fib grids (weekly, monthly, yearly) suggests the market is consolidating after its recent rally, with no clear breakout above long-term resistance yet. Volatility has moderated, and the market is in a potential transition phase, with the possibility of either a continued recovery or a retest of lower support if resistance holds. The overall structure is constructive for swing traders watching for confirmation of trend continuation or signs of reversal at these resistance levels.