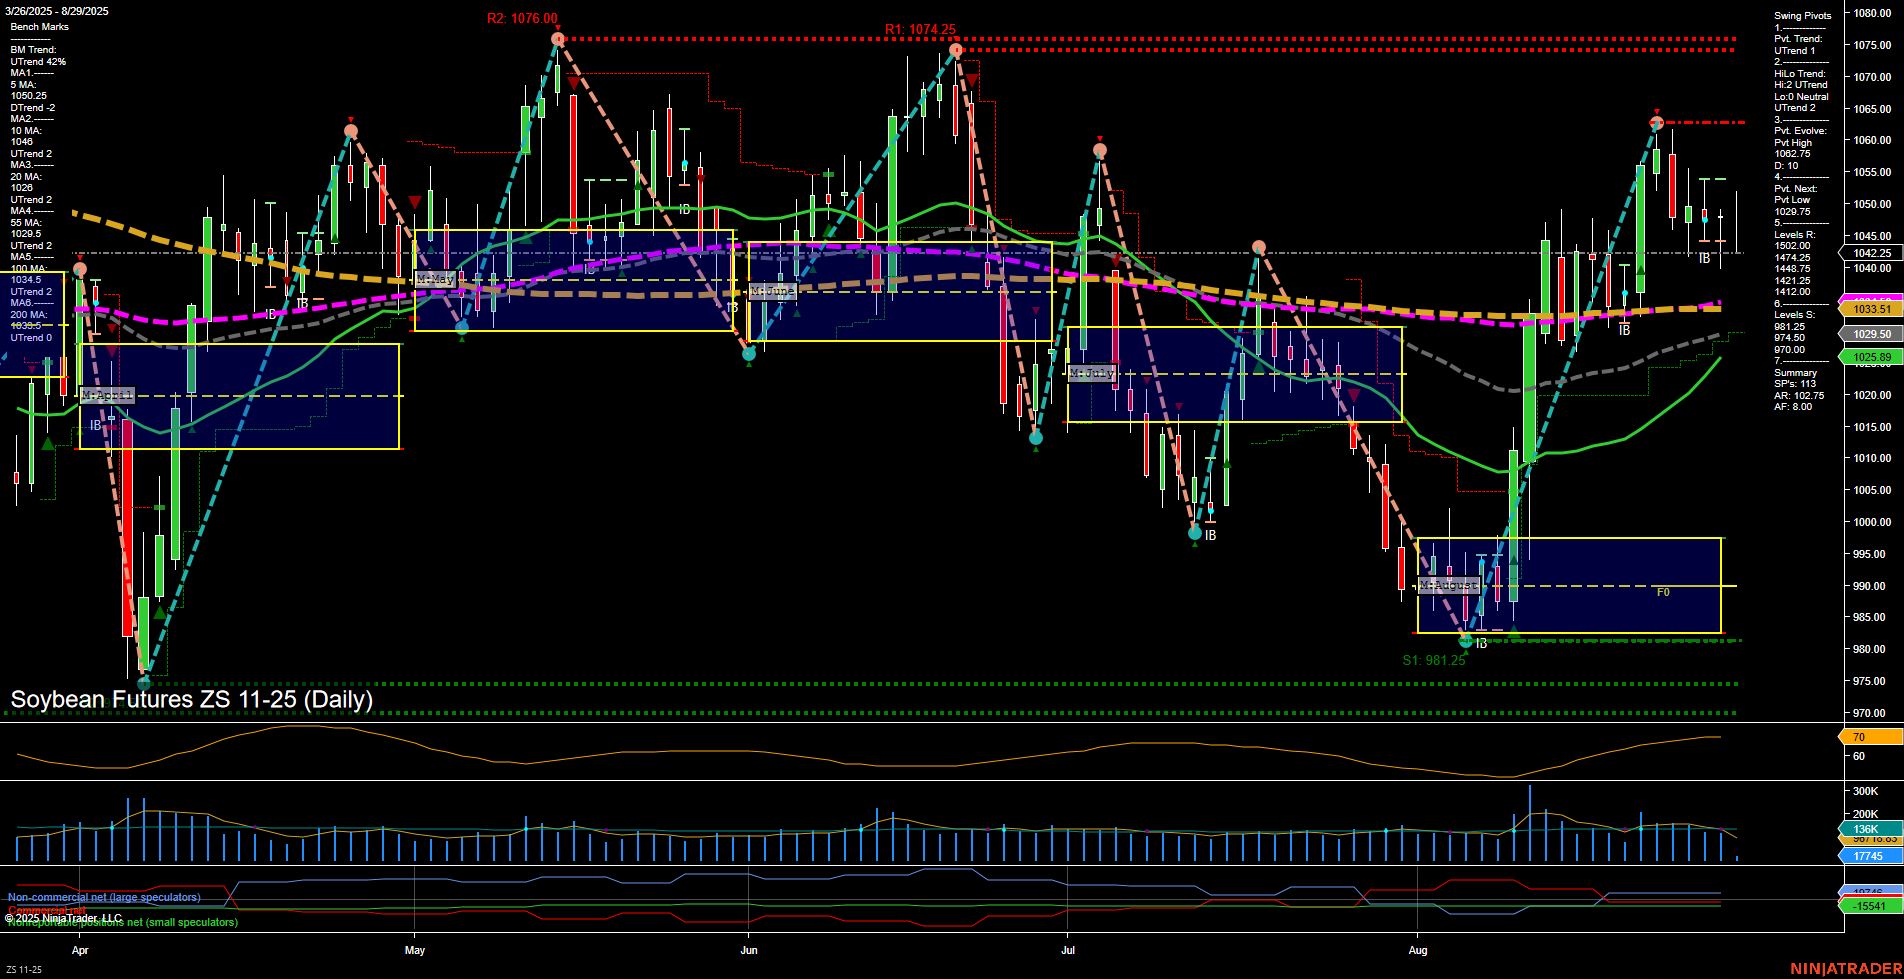
ZS Soybean Futures Daily Chart Analysis: 2025-Aug-29 07:20 CT
Price Action
- Last: 1042.25,
- Bars: Medium,
- Mom: Momentum average.
WSFG Weekly
- Short-Term
- WSFG Current: -41%
- F0%/NTZ' Bias: Price Below,
- WSFG Trend: Down.
MSFG Month Aug
- Intermediate-Term
- MSFG Current: 87%
- F0%/NTZ' Bias: Price Above,
- MSFG Trend: Up.
YSFG Year 2025
- Long-Term
- YSFG Current: 9%
- F0%/NTZ' Bias: Price Above,
- YSFG Trend: Up.
Swing Pivots
- (Short-Term) 1. Pvt. Trend: UTrend,
- (Intermediate-Term) 2. HiLo Trend: UTrend,
- 3. Pvt. Evolve: Pvt High 1060.75,
- 4. Pvt. Next: Pvt Low 1028.75,
- 5. Levels R: 1060.75, 1076.00, 1074.25,
- 6. Levels S: 1028.75, 1015.25, 1004.25, 974.50, 970.00.
Daily Benchmarks
- (Short-Term) 5 Day: 1046.25 Up Trend,
- (Short-Term) 10 Day: 1039.25 Up Trend,
- (Intermediate-Term) 20 Day: 1033.51 Up Trend,
- (Intermediate-Term) 55 Day: 1025.50 Up Trend,
- (Long-Term) 100 Day: 1040.40 Down Trend,
- (Long-Term) 200 Day: 1043.95 Down Trend.
Additional Metrics
Recent Trade Signals
- 27 Aug 2025: Short ZS 11-25 @ 1049.75 Signals.USAR-WSFG
- 21 Aug 2025: Long ZS 11-25 @ 1049.25 Signals.USAR.TR120
Overall Rating
- Short-Term: Bullish,
- Intermediate-Term: Bullish,
- Long-Term: Neutral.
Key Insights Summary
Soybean futures are currently showing a strong recovery from the August lows, with price action supported by a series of higher swing lows and a short-term uptrend in both swing pivots and moving averages. The intermediate-term (monthly) and long-term (yearly) session fib grids both indicate price is above their respective NTZ/F0% levels, confirming an upward bias. However, the long-term moving averages (100 and 200 day) remain in a downtrend, suggesting the broader trend is still neutral and not fully reversed. Recent trade signals show mixed short-term direction, with a recent short entry following a prior long, reflecting some choppiness and possible profit-taking after a sharp rally. Volatility (ATR) is moderate, and volume is steady, indicating active participation but not extreme conditions. Key resistance is clustered near 1060–1076, while support is layered down to 970, providing clear levels for swing traders to monitor for potential reversals or breakouts. Overall, the market is in a bullish phase short- and intermediate-term, but faces significant overhead resistance and a neutral long-term backdrop, suggesting a period of consolidation or range trading may develop unless a decisive breakout occurs.
Chart Analysis ATS AI Generated: 2025-08-29 07:20 for Informational use only, not trading advice. Terms and Risk Disclosure Copyright © 2025. Algo Trading Systems LLC.
