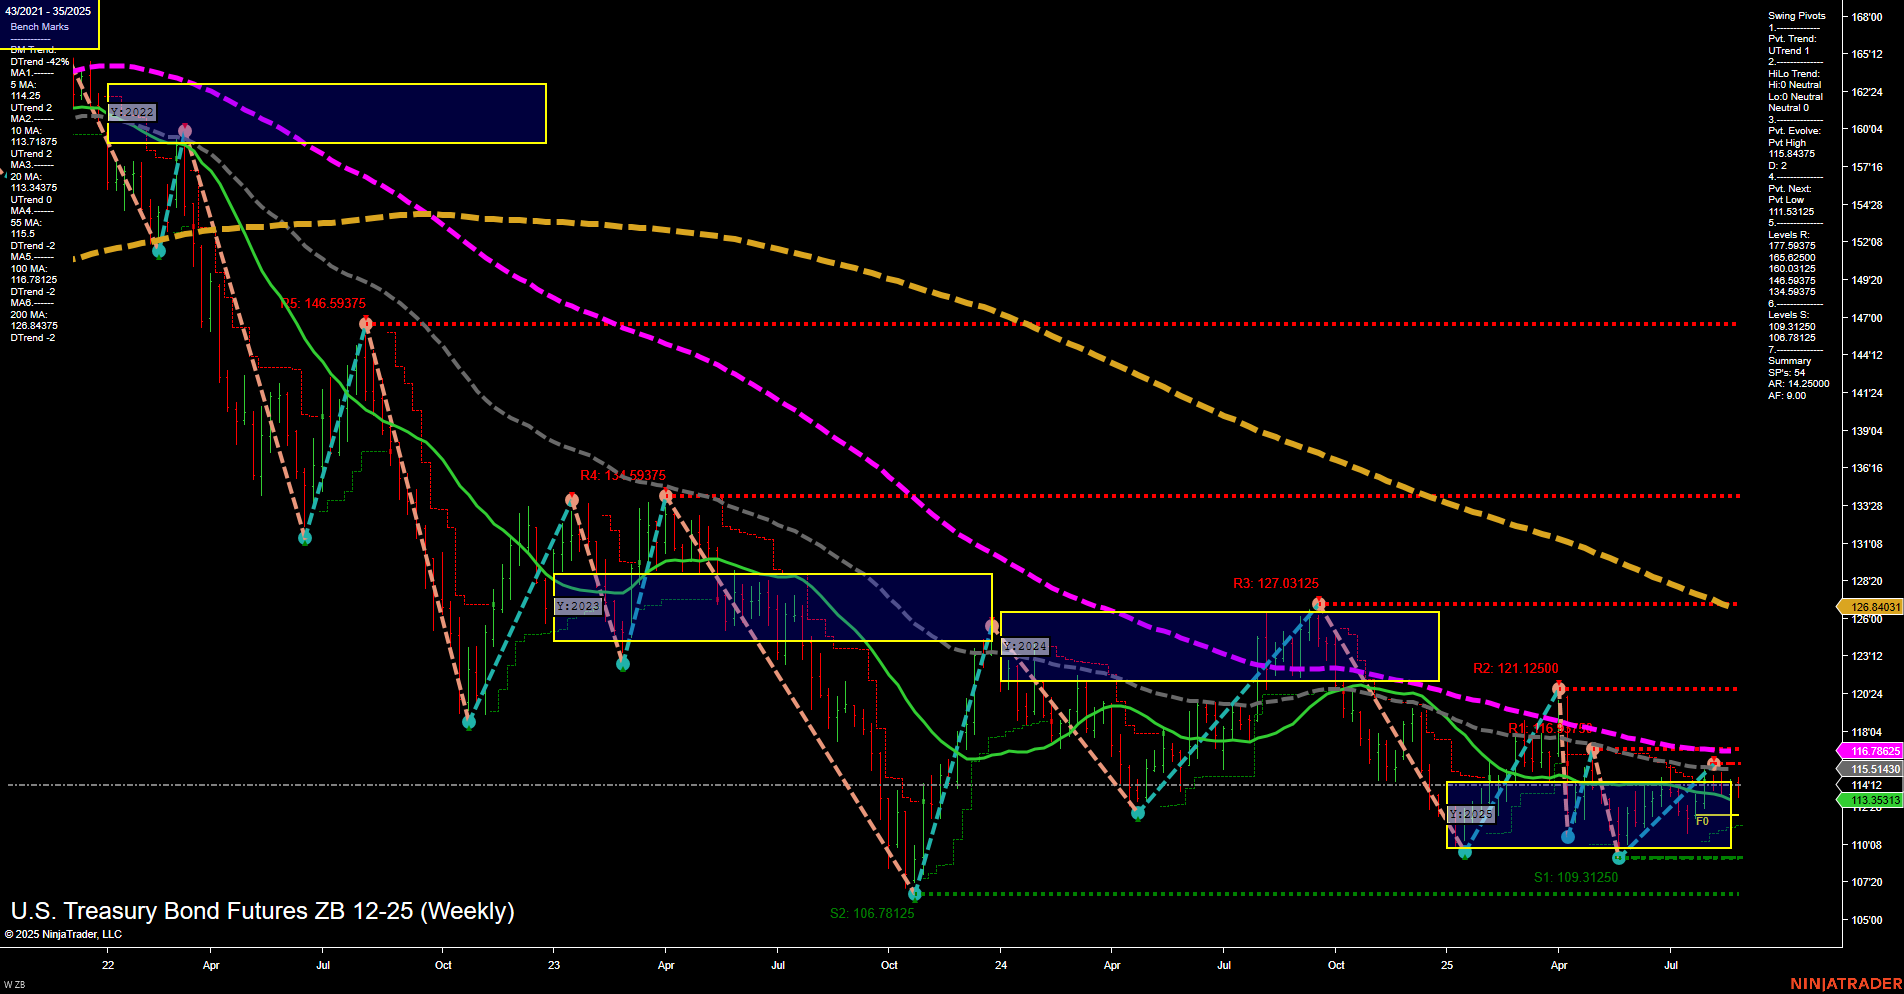
ZB U.S. Treasury Bond Futures Weekly Chart Analysis: 2025-Aug-29 07:19 CT
Price Action
- Last: 126.84031,
- Bars: Medium,
- Mom: Momentum slow.
WSFG Weekly
- Short-Term
- WSFG Current: NA%
- F0%/NTZ' Bias: Price Neutral,
- WSFG Trend: Neutral.
MSFG Month Aug
- Intermediate-Term
- MSFG Current: NA%
- F0%/NTZ' Bias: Price Neutral,
- MSFG Trend: Neutral.
YSFG Year 2025
- Long-Term
- YSFG Current: NA%
- F0%/NTZ' Bias: Price Neutral,
- YSFG Trend: Neutral.
Swing Pivots
- (Short-Term) 1. Pvt. Trend: UTrend,
- (Intermediate-Term) 2. HiLo Trend: Neutral,
- 3. Pvt. Evolve: Pvt high 115.84375,
- 4. Pvt. Next: Pvt low 111.53125,
- 5. Levels R: 146.59375, 127.03125, 121.12500, 116.84375,
- 6. Levels S: 109.31250, 106.78125.
Weekly Benchmarks
- (Intermediate-Term) 5 Week: 114.26 Up Trend,
- (Intermediate-Term) 10 Week: 113.18 Up Trend,
- (Long-Term) 20 Week: 115.34 Up Trend,
- (Long-Term) 55 Week: 116.78 Down Trend,
- (Long-Term) 100 Week: 120.84 Down Trend,
- (Long-Term) 200 Week: 146.59 Down Trend.
Overall Rating
- Short-Term: Neutral,
- Intermediate-Term: Neutral,
- Long-Term: Bearish.
Key Insights Summary
The ZB U.S. Treasury Bond Futures weekly chart shows a market in consolidation, with price action contained within a neutral zone as indicated by the NTZ and F0% levels. Momentum is slow and bars are of medium size, reflecting a lack of strong directional conviction. The short-term swing pivot trend is up, but the intermediate-term HiLo trend is neutral, suggesting indecision and a potential for range-bound trading. Key resistance levels are clustered above, notably at 127.03 and 121.12, while support is found at 109.31 and 106.78. Benchmark moving averages show short- and intermediate-term uptrends, but longer-term averages remain in a downtrend, highlighting persistent bearish pressure on a broader timeframe. Overall, the market is in a holding pattern, with neither bulls nor bears in clear control, and price is likely to remain choppy until a decisive breakout or breakdown occurs.
Chart Analysis ATS AI Generated: 2025-08-29 07:19 for Informational use only, not trading advice. Terms and Risk Disclosure Copyright © 2025. Algo Trading Systems LLC.
