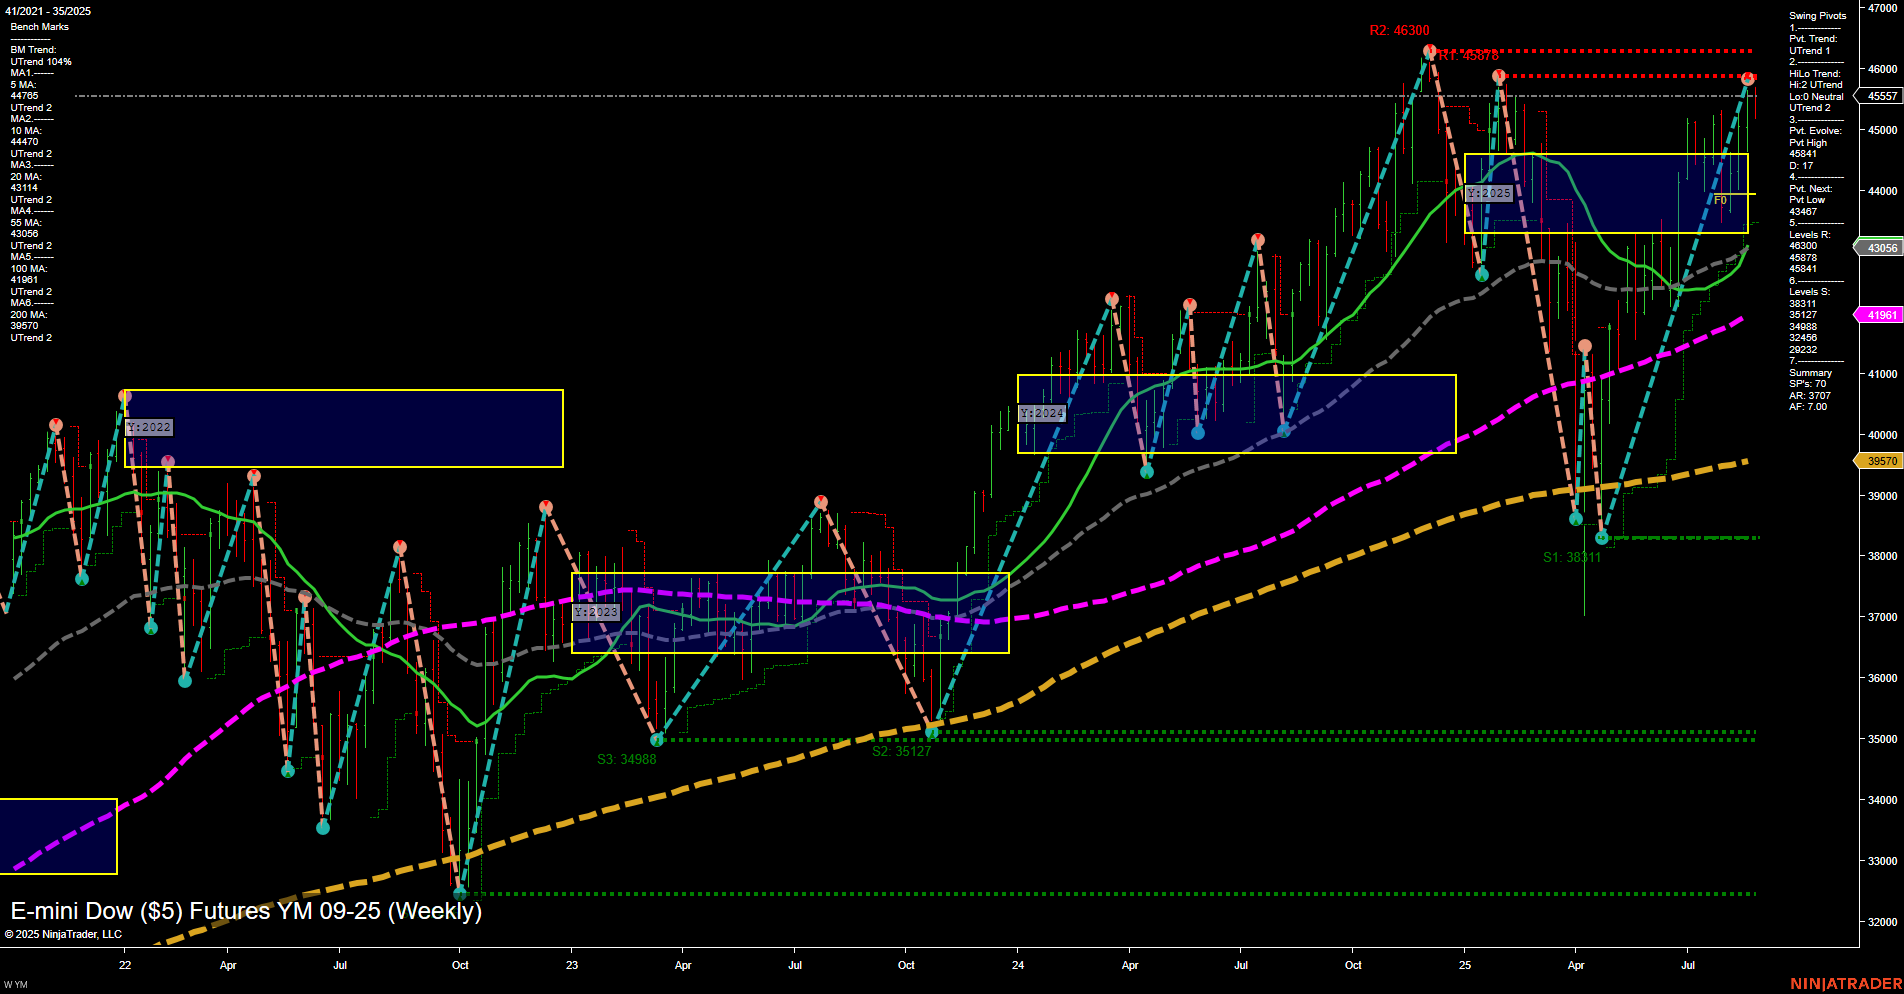
YM E-mini Dow ($5) Futures Weekly Chart Analysis: 2025-Aug-29 07:19 CT
Price Action
- Last: 43095,
- Bars: Large,
- Mom: Momentum fast.
WSFG Weekly
- Short-Term
- WSFG Current: -13%
- F0%/NTZ' Bias: Price Below,
- WSFG Trend: Down.
MSFG Month Aug
- Intermediate-Term
- MSFG Current: 67%
- F0%/NTZ' Bias: Price Above,
- MSFG Trend: Up.
YSFG Year 2025
- Long-Term
- YSFG Current: 25%
- F0%/NTZ' Bias: Price Above,
- YSFG Trend: Up.
Swing Pivots
- (Short-Term) 1. Pvt. Trend: UTrend,
- (Intermediate-Term) 2. HiLo Trend: UTrend,
- 3. Pvt. Evolve: Pvt high 46300,
- 4. Pvt. Next: Pvt low 43467,
- 5. Levels R: 46300, 45878,
- 6. Levels S: 38111, 35127, 34988.
Weekly Benchmarks
- (Intermediate-Term) 5 Week: 44706 Down Trend,
- (Intermediate-Term) 10 Week: 44470 Down Trend,
- (Long-Term) 20 Week: 41961 Up Trend,
- (Long-Term) 55 Week: 40635 Up Trend,
- (Long-Term) 100 Week: 38212 Up Trend,
- (Long-Term) 200 Week: 39570 Up Trend.
Recent Trade Signals
- 29 Aug 2025: Short YM 09-25 @ 45586 Signals.USAR-WSFG
- 27 Aug 2025: Long YM 09-25 @ 45575 Signals.USAR.TR120
Overall Rating
- Short-Term: Bearish,
- Intermediate-Term: Bullish,
- Long-Term: Bullish.
Key Insights Summary
The YM E-mini Dow futures weekly chart shows a market in transition. Price action is volatile with large bars and fast momentum, reflecting heightened activity and possible news-driven moves. Short-term metrics, including the WSFG trend and recent short trade signal, indicate a bearish bias, with price currently below the NTZ and both 5- and 10-week moving averages trending down. However, intermediate- and long-term trends remain bullish, supported by the MSFG and YSFG trends, as well as upward-sloping 20-, 55-, 100-, and 200-week moving averages. Swing pivots highlight a recent high at 46300 and a next potential support pivot at 43467, with major resistance at 46300/45878 and support at 38111/35127/34988. The market appears to be in a corrective phase within a broader uptrend, with the potential for further pullbacks before resuming higher if long-term support levels hold. This environment is characterized by choppy price action and possible retracements, with the overall structure favoring trend continuation on the higher timeframes.
Chart Analysis ATS AI Generated: 2025-08-29 07:19 for Informational use only, not trading advice. Terms and Risk Disclosure Copyright © 2025. Algo Trading Systems LLC.
