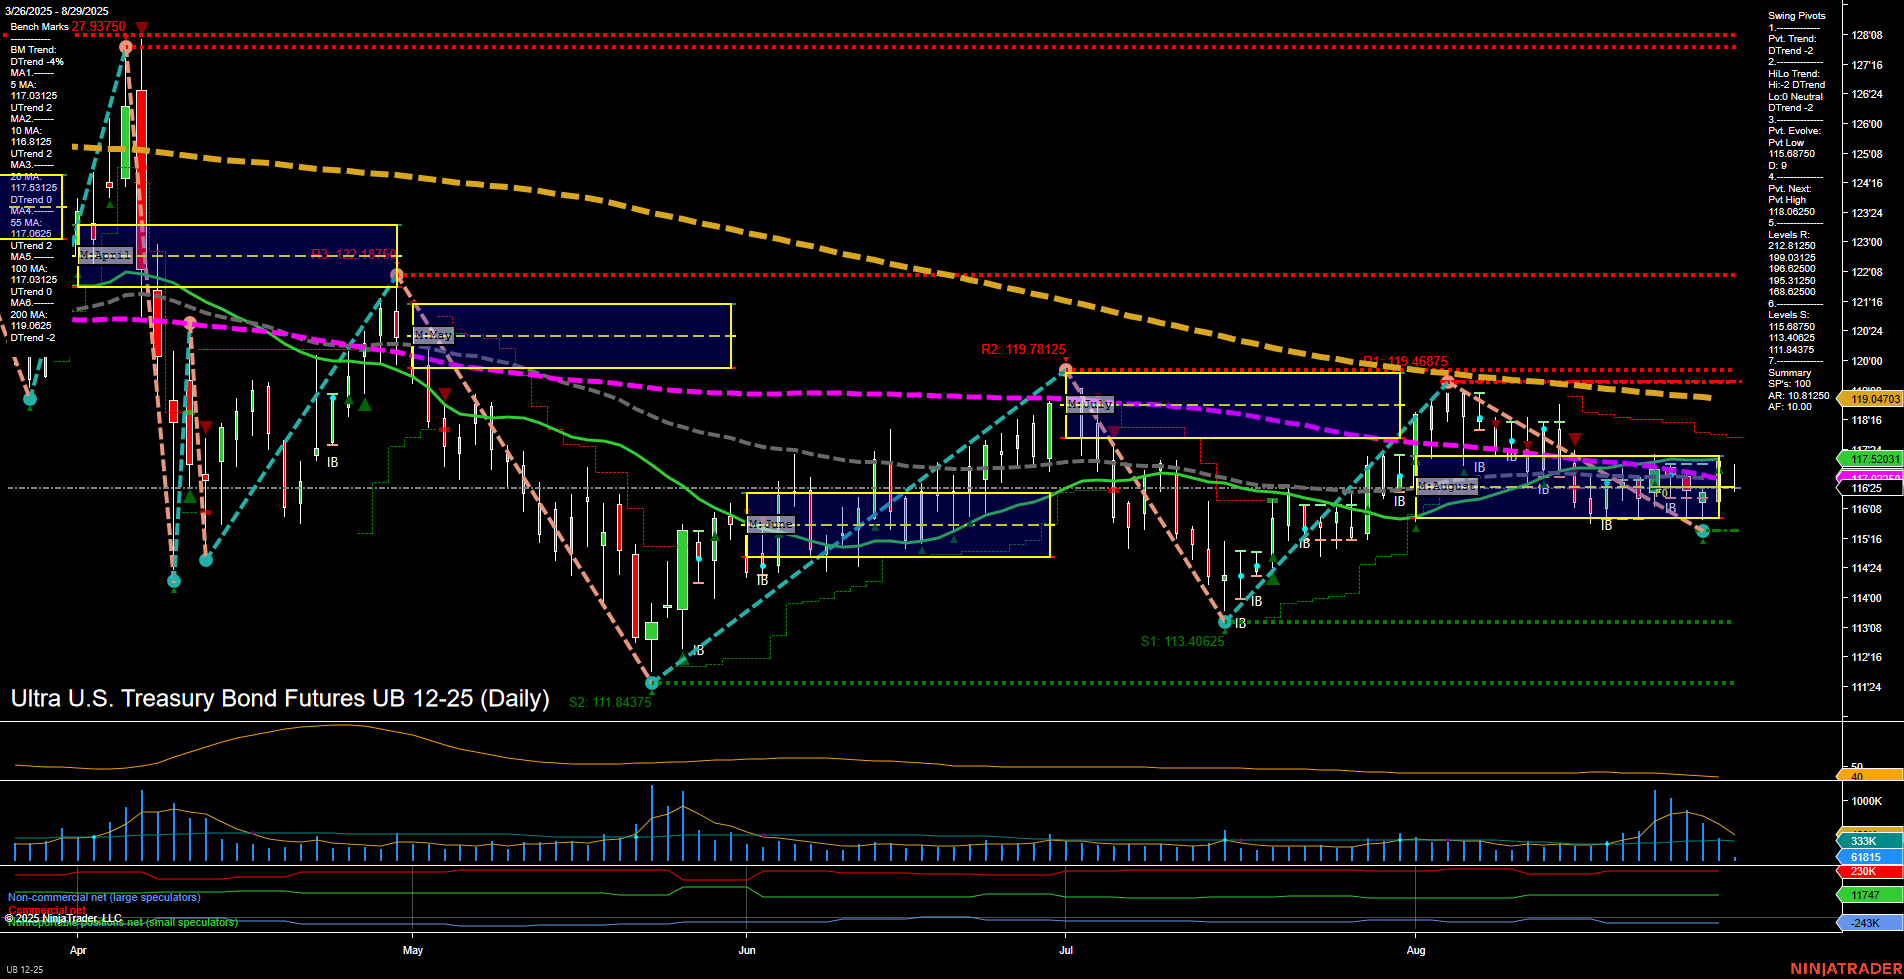
UB Ultra U.S. Treasury Bond Futures Daily Chart Analysis: 2025-Aug-29 07:16 CT
Price Action
- Last: 116.25,
- Bars: Small,
- Mom: Momentum slow.
WSFG Weekly
- Short-Term
- WSFG Current: -16%
- F0%/NTZ' Bias: Price Below,
- WSFG Trend: Down.
MSFG Month Aug
- Intermediate-Term
- MSFG Current: 4%
- F0%/NTZ' Bias: Price Above,
- MSFG Trend: Up.
YSFG Year 2025
- Long-Term
- YSFG Current: -3%
- F0%/NTZ' Bias: Price Below,
- YSFG Trend: Down.
Swing Pivots
- (Short-Term) 1. Pvt. Trend: DTrend,
- (Intermediate-Term) 2. HiLo Trend: DTrend,
- 3. Pvt. Evolve: Pvt low 116.0625,
- 4. Pvt. Next: Pvt high 119.46875,
- 5. Levels R: 119.78125, 119.46875, 119.03125, 118.625, 118.3125, 117.84375, 117.53125,
- 6. Levels S: 116.0625, 113.40625, 111.84375.
Daily Benchmarks
- (Short-Term) 5 Day: 117.0625 Down Trend,
- (Short-Term) 10 Day: 117.03125 Down Trend,
- (Intermediate-Term) 20 Day: 117.5031 Down Trend,
- (Intermediate-Term) 55 Day: 119.04703 Down Trend,
- (Long-Term) 100 Day: 119.84375 Down Trend,
- (Long-Term) 200 Day: 127.9375 Down Trend.
Additional Metrics
Recent Trade Signals
- 29 Aug 2025: Short UB 12-25 @ 116.75 Signals.USAR-WSFG
- 28 Aug 2025: Long UB 12-25 @ 117.28125 Signals.USAR-MSFG
- 28 Aug 2025: Long UB 12-25 @ 117 Signals.USAR.TR120
Overall Rating
- Short-Term: Bearish,
- Intermediate-Term: Neutral,
- Long-Term: Bearish.
Key Insights Summary
The UB Ultra U.S. Treasury Bond Futures daily chart shows a market under pressure, with price action characterized by small bars and slow momentum, indicating a lack of strong directional conviction. The short-term (weekly) trend is clearly down, with price trading below the NTZ and all short-term benchmarks in a downtrend. Intermediate-term (monthly) signals are mixed: while the MSFG trend is up and price is above the monthly NTZ, the swing pivot structure and moving averages remain bearish, suggesting a possible countertrend rally or consolidation phase rather than a sustained reversal. Long-term (yearly) structure remains bearish, with price below key yearly levels and all major moving averages trending down. Recent trade signals reflect this mixed environment, with both short and long entries triggered in the last two sessions, highlighting choppy, range-bound conditions. Resistance is layered above in the 117.5–119.8 zone, while support is clustered at 116.06 and lower at 113.40 and 111.84. Volatility (ATR) is moderate, and volume is steady but not elevated. Overall, the market is in a corrective or consolidative phase within a broader bearish context, with short-term downside pressure dominating but some intermediate-term attempts at stabilization or bounce.
Chart Analysis ATS AI Generated: 2025-08-29 07:17 for Informational use only, not trading advice. Terms and Risk Disclosure Copyright © 2025. Algo Trading Systems LLC.
