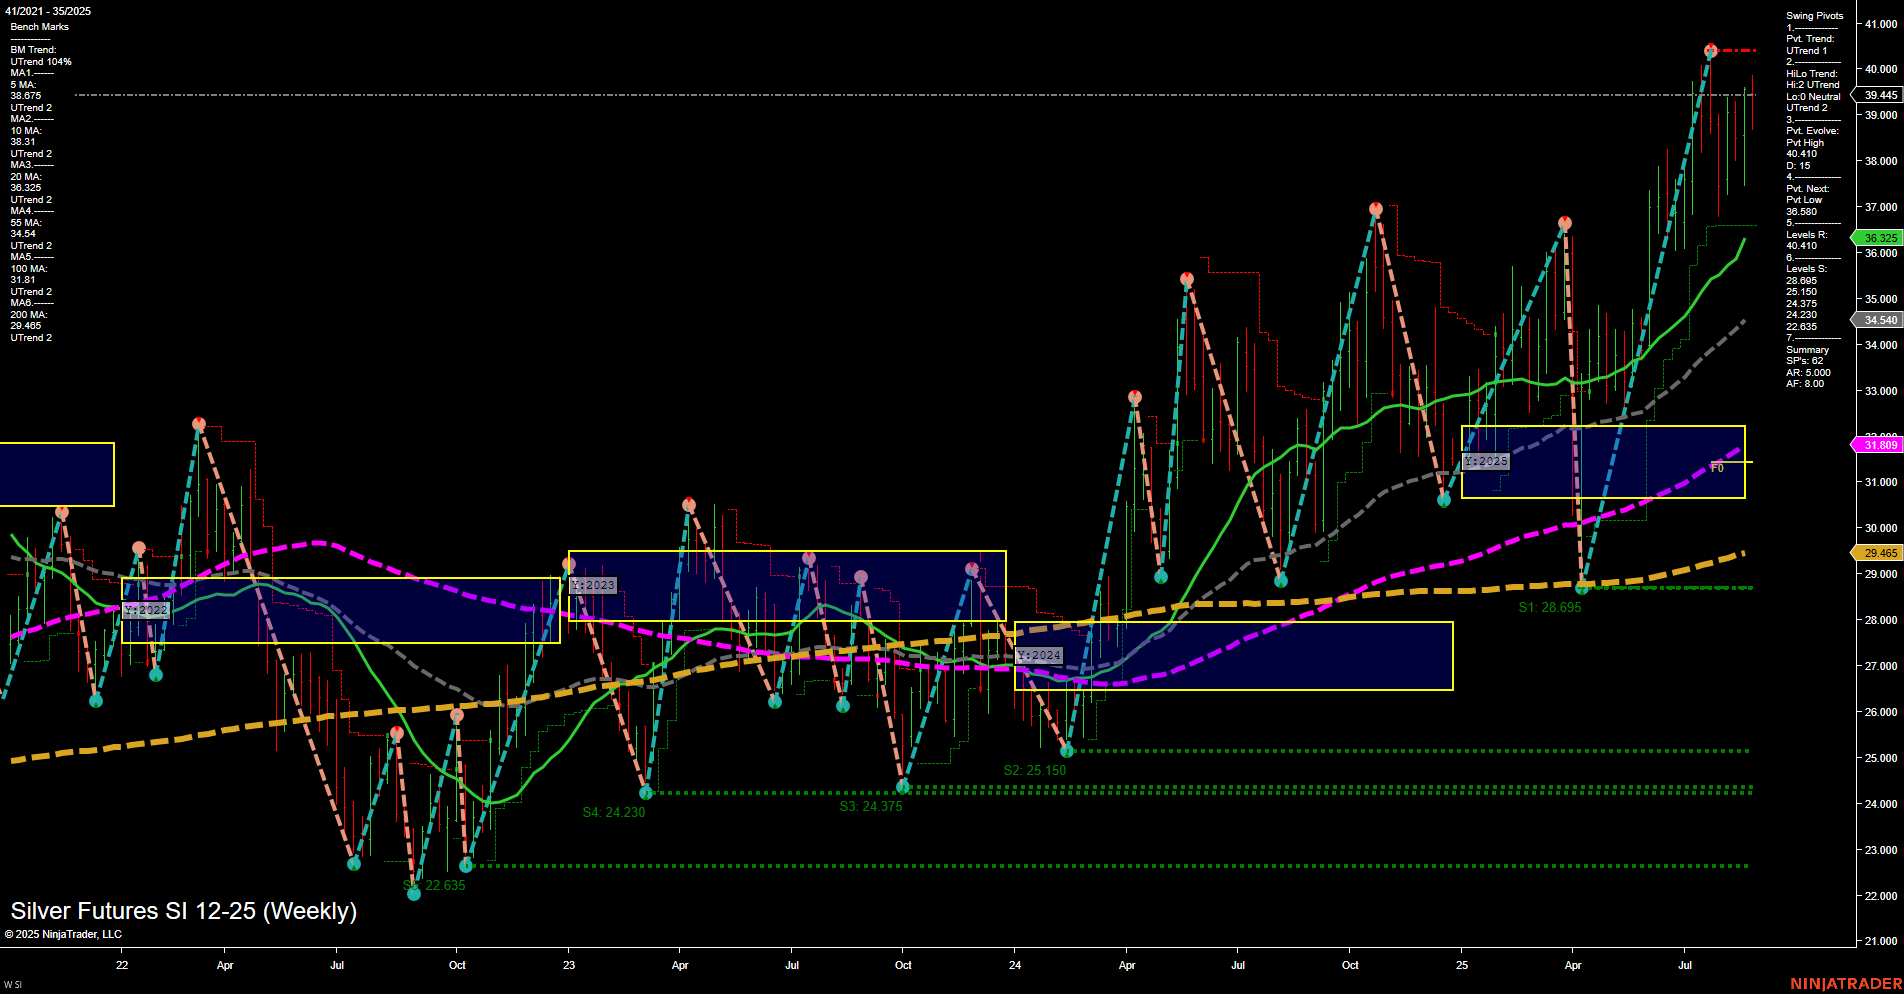
SI Silver Futures Weekly Chart Analysis: 2025-Aug-29 07:15 CT
Price Action
- Last: 40.410,
- Bars: Large,
- Mom: Momentum fast.
WSFG Weekly
- Short-Term
- WSFG Current: 2%
- F0%/NTZ' Bias: Price Above,
- WSFG Trend: Up.
MSFG Month Aug
- Intermediate-Term
- MSFG Current: 68%
- F0%/NTZ' Bias: Price Above,
- MSFG Trend: Up.
YSFG Year 2025
- Long-Term
- YSFG Current: 102%
- F0%/NTZ' Bias: Price Above,
- YSFG Trend: Up.
Swing Pivots
- (Short-Term) 1. Pvt. Trend: UTrend,
- (Intermediate-Term) 2. HiLo Trend: UTrend,
- 3. Pvt. Evolve: Pvt High 40.410,
- 4. Pvt. Next: Pvt Low 36.825,
- 5. Levels R: 40.410, 39.445, 39.045,
- 6. Levels S: 36.825, 34.750, 34.540.
Weekly Benchmarks
- (Intermediate-Term) 5 Week: 38.675 Up Trend,
- (Intermediate-Term) 10 Week: 37.311 Up Trend,
- (Long-Term) 20 Week: 36.325 Up Trend,
- (Long-Term) 55 Week: 31.689 Up Trend,
- (Long-Term) 100 Week: 29.465 Up Trend,
- (Long-Term) 200 Week: 29.465 Up Trend.
Recent Trade Signals
- 29 Aug 2025: Long SI 12-25 @ 39.675 Signals.USAR-WSFG
- 27 Aug 2025: Short SI 12-25 @ 38.81 Signals.USAR.TR120
Overall Rating
- Short-Term: Bullish,
- Intermediate-Term: Bullish,
- Long-Term: Bullish.
Key Insights Summary
Silver futures are exhibiting a strong bullish structure across all timeframes. Price action is robust, with large bars and fast momentum, indicating aggressive buying and a potential breakout environment. The price is trading well above all key session fib grid levels (weekly, monthly, yearly), and the NTZ/F0% bias confirms sustained strength above value zones. Swing pivots show a clear uptrend in both short- and intermediate-term, with the most recent pivot high at 40.410 and next support at 36.825, suggesting higher lows and a stair-step rally pattern. All benchmark moving averages are trending upward, reinforcing the underlying strength and confirming the multi-timeframe uptrend. Recent trade signals reflect active participation in both directions, but the latest signal aligns with the prevailing bullish momentum. The overall technical landscape points to a continuation of the uptrend, with volatility and momentum favoring trend-following strategies. The market is in a strong rally phase, with no immediate signs of exhaustion or reversal.
Chart Analysis ATS AI Generated: 2025-08-29 07:15 for Informational use only, not trading advice. Terms and Risk Disclosure Copyright © 2025. Algo Trading Systems LLC.
