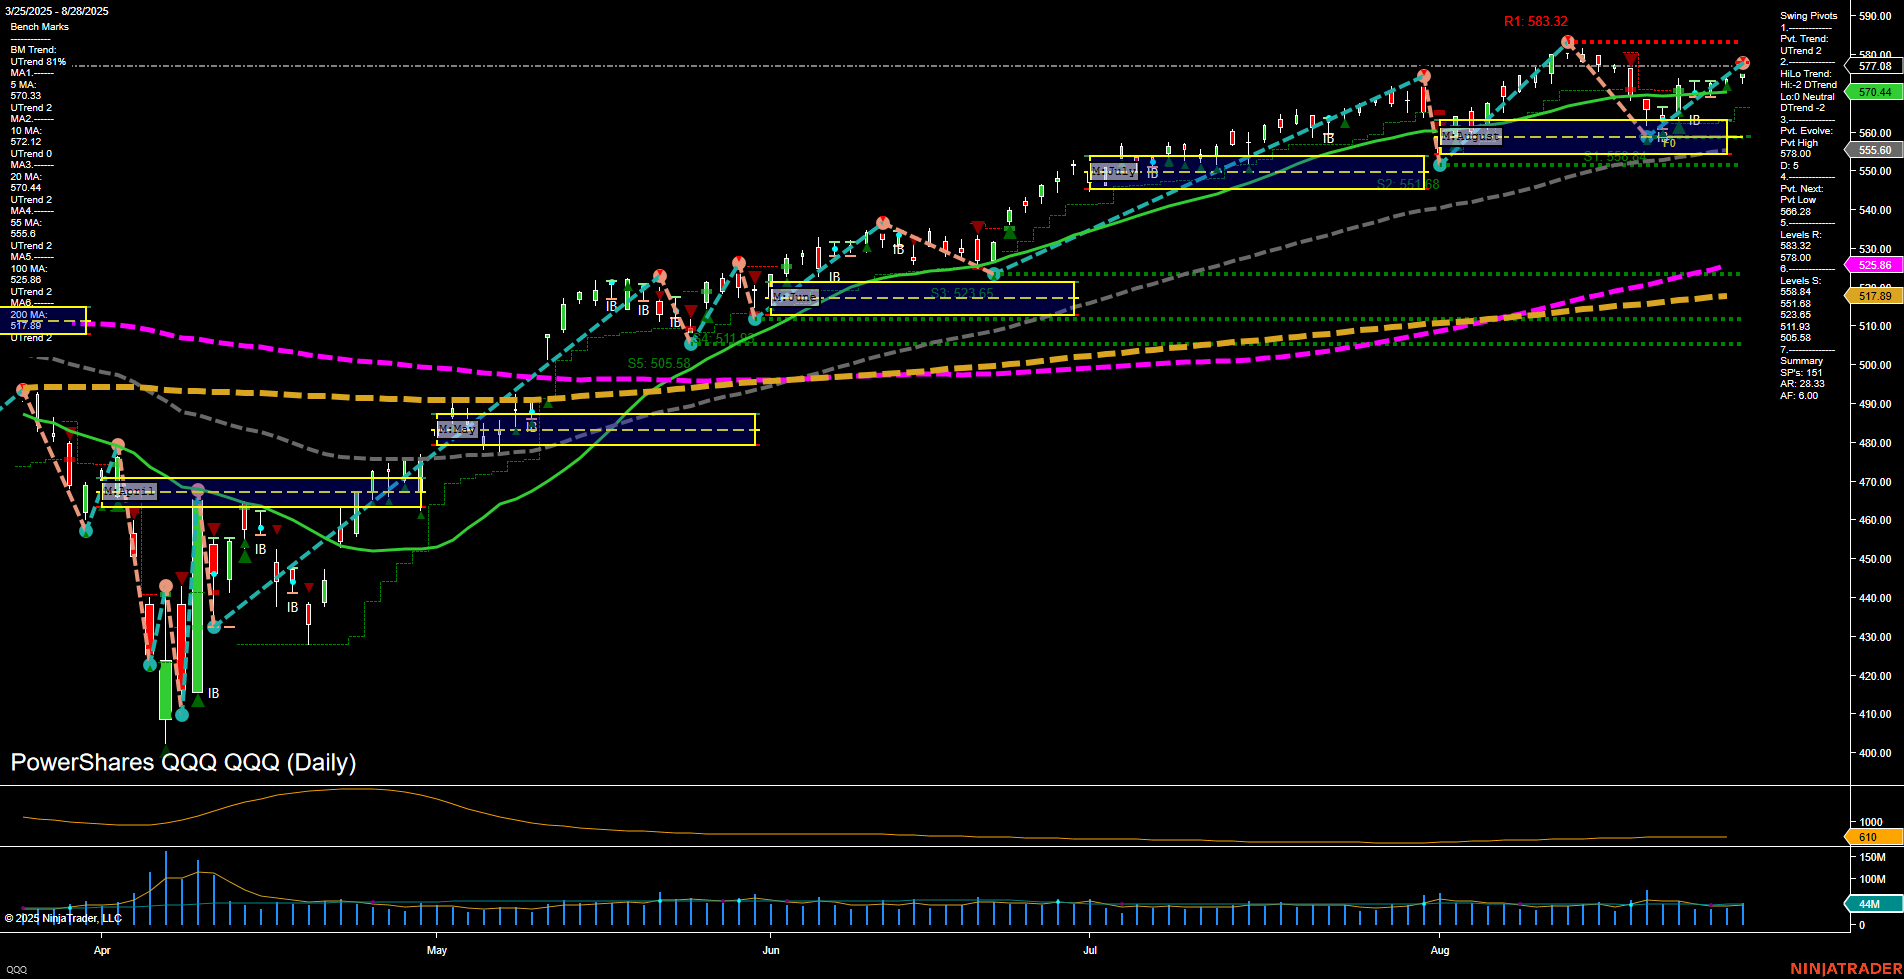
QQQ PowerShares QQQ Daily Chart Analysis: 2025-Aug-29 07:12 CT
Price Action
- Last: 577.08,
- Bars: Medium,
- Mom: Average.
WSFG Weekly
- Short-Term
- WSFG Current: NA%
- F0%/NTZ' Bias: Price Neutral,
- WSFG Trend: Neutral.
MSFG Month Aug
- Intermediate-Term
- MSFG Current: NA%
- F0%/NTZ' Bias: Price Neutral,
- MSFG Trend: Neutral.
YSFG Year 2025
- Long-Term
- YSFG Current: NA%
- F0%/NTZ' Bias: Price Neutral,
- YSFG Trend: Neutral.
Swing Pivots
- (Short-Term) 1. Pvt. Trend: UTrend,
- (Intermediate-Term) 2. HiLo Trend: DTrend,
- 3. Pvt. Evolve: Pvt High 583.32,
- 4. Pvt. Next: Pvt Low 555.66,
- 5. Levels R: 583.32, 578.02,
- 6. Levels S: 526.86, 517.89, 505.58.
Daily Benchmarks
- (Short-Term) 5 Day: 573.03 Up Trend,
- (Short-Term) 10 Day: 570.44 Up Trend,
- (Intermediate-Term) 20 Day: 572.12 Up Trend,
- (Intermediate-Term) 55 Day: 551.46 Up Trend,
- (Long-Term) 100 Day: 526.86 Up Trend,
- (Long-Term) 200 Day: 517.89 Up Trend.
Additional Metrics
Overall Rating
- Short-Term: Bullish,
- Intermediate-Term: Neutral,
- Long-Term: Bullish.
Key Insights Summary
The QQQ daily chart shows a strong bullish structure in the short and long term, with all key moving averages trending upward and price holding above major support levels. The most recent swing pivot is a high at 583.32, with the next potential pivot low at 555.66, indicating a possible area for a pullback or consolidation. Resistance is clustered near recent highs, while support is well-defined below, suggesting a healthy uptrend with room for retracement. ATR and volume metrics indicate moderate volatility and steady participation. The intermediate-term trend is neutral, reflecting some consolidation or digestion of gains after a strong rally. Overall, the chart reflects a market in a bullish phase, but with the potential for short-term pullbacks as price tests resistance and digests recent advances.
Chart Analysis ATS AI Generated: 2025-08-29 07:13 for Informational use only, not trading advice. Terms and Risk Disclosure Copyright © 2025. Algo Trading Systems LLC.
