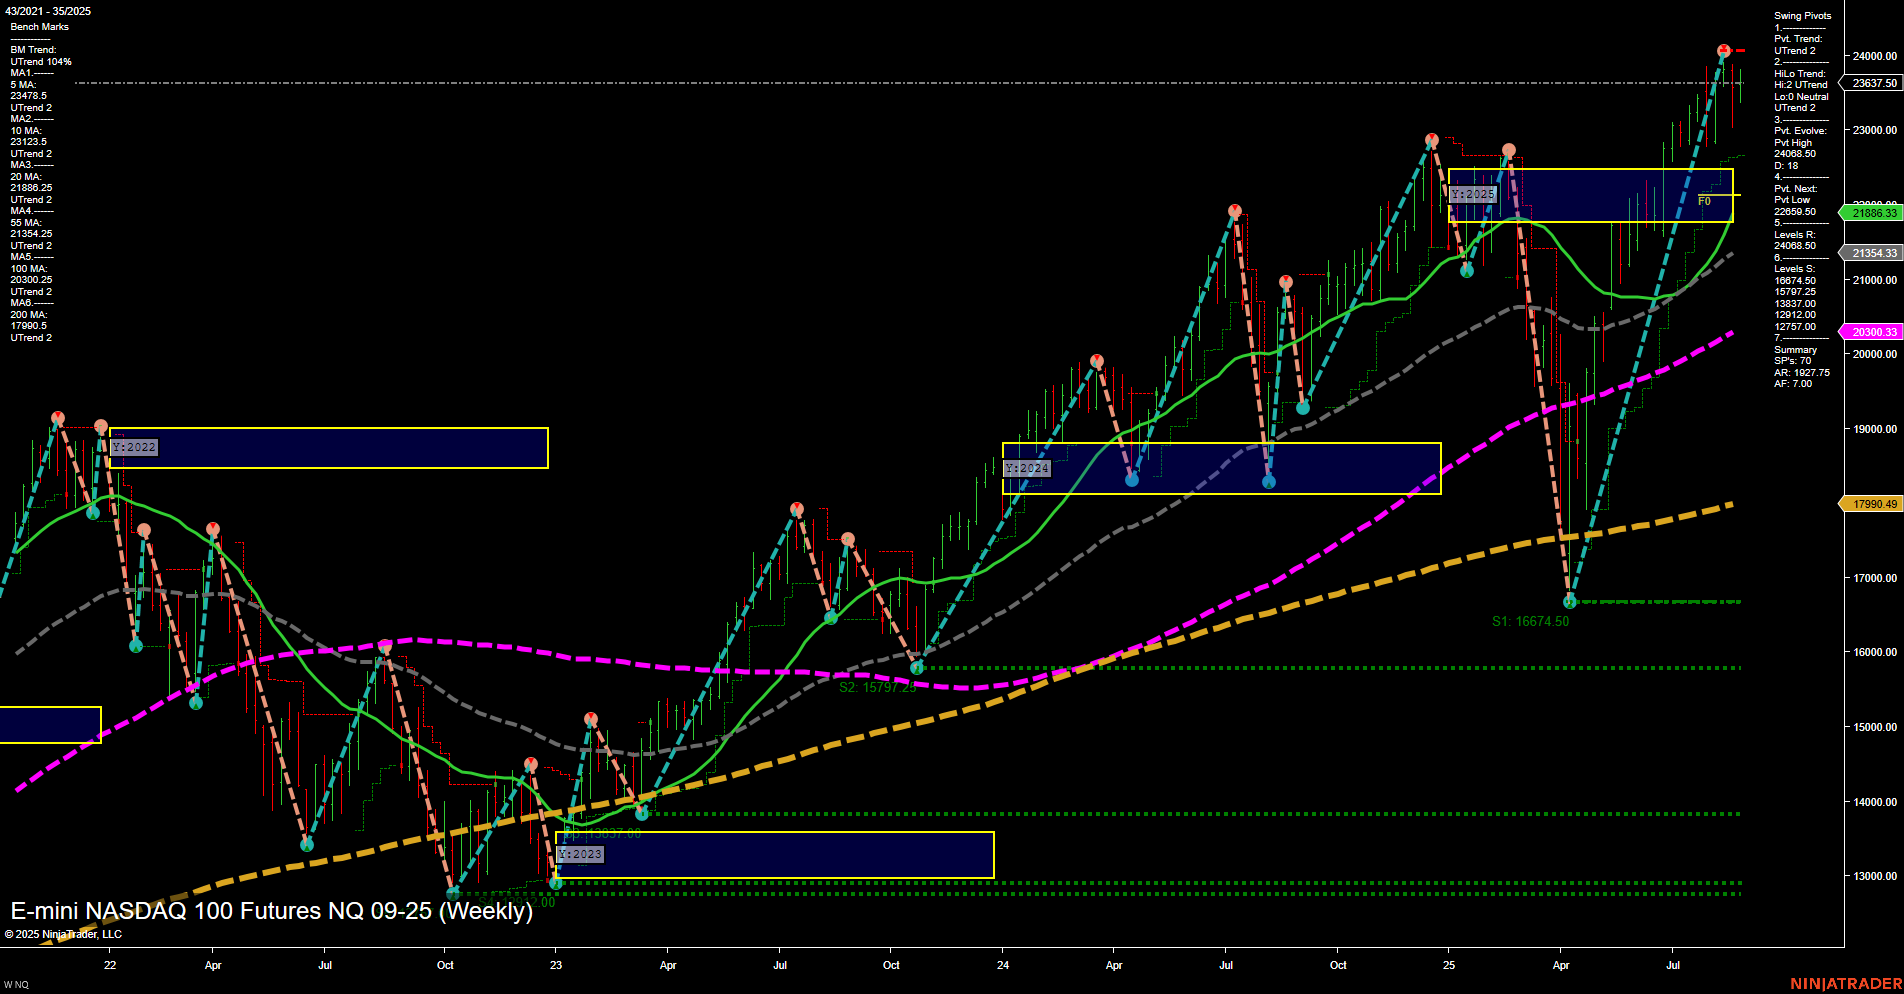
NQ E-mini NASDAQ 100 Futures Weekly Chart Analysis: 2025-Aug-29 07:12 CT
Price Action
- Last: 23,637.50,
- Bars: Medium,
- Mom: Momentum average.
WSFG Weekly
- Short-Term
- WSFG Current: 4%
- F0%/NTZ' Bias: Price Above,
- WSFG Trend: Up.
MSFG Month Aug
- Intermediate-Term
- MSFG Current: 20%
- F0%/NTZ' Bias: Price Above,
- MSFG Trend: Up.
YSFG Year 2025
- Long-Term
- YSFG Current: 42%
- F0%/NTZ' Bias: Price Above,
- YSFG Trend: Up.
Swing Pivots
- (Short-Term) 1. Pvt. Trend: UTrend,
- (Intermediate-Term) 2. HiLo Trend: UTrend,
- 3. Pvt. Evolve: Pvt high 24,003,
- 4. Pvt. Next: Pvt low 21,050.5,
- 5. Levels R: 24,003, 23,637.5, 22,608.5, 21,343.5,
- 6. Levels S: 21,050.5, 20,000, 18,377, 17,277, 16,674.5, 15,797.5, 13,277.
Weekly Benchmarks
- (Intermediate-Term) 5 Week: 23,478.5 Up Trend,
- (Intermediate-Term) 10 Week: 23,123.5 Up Trend,
- (Long-Term) 20 Week: 21,886.33 Up Trend,
- (Long-Term) 55 Week: 20,303.93 Up Trend,
- (Long-Term) 100 Week: 20,000 Up Trend,
- (Long-Term) 200 Week: 17,990.49 Up Trend.
Recent Trade Signals
- 29 Aug 2025: Long NQ 09-25 @ 23,724.25 Signals.USAR-WSFG
- 28 Aug 2025: Long NQ 09-25 @ 23,631.25 Signals.USAR-MSFG
- 22 Aug 2025: Long NQ 09-25 @ 23,606.25 Signals.USAR.TR120
Overall Rating
- Short-Term: Bullish,
- Intermediate-Term: Bullish,
- Long-Term: Bullish.
Key Insights Summary
The NQ E-mini NASDAQ 100 Futures weekly chart shows a strong bullish structure across all timeframes. Price is trading above all major moving averages, with each benchmark MA in a clear uptrend, confirming robust underlying momentum. The swing pivot structure highlights a series of higher highs and higher lows, with the most recent pivot high at 24,003 and the next key support at 21,050.5. The price remains well above the NTZ (neutral zone) center lines for weekly, monthly, and yearly session fib grids, reinforcing the prevailing uptrend. Recent trade signals have all triggered on the long side, aligning with the technical trend. The market has demonstrated resilience after previous pullbacks, with a notable V-shaped recovery earlier in the year and continued follow-through to new highs. The environment is characterized by trend continuation, with no immediate signs of exhaustion or reversal, and support levels are well-defined below. The overall technical landscape remains constructive for swing traders monitoring for trend persistence and potential pullbacks to support.
Chart Analysis ATS AI Generated: 2025-08-29 07:12 for Informational use only, not trading advice. Terms and Risk Disclosure Copyright © 2025. Algo Trading Systems LLC.
