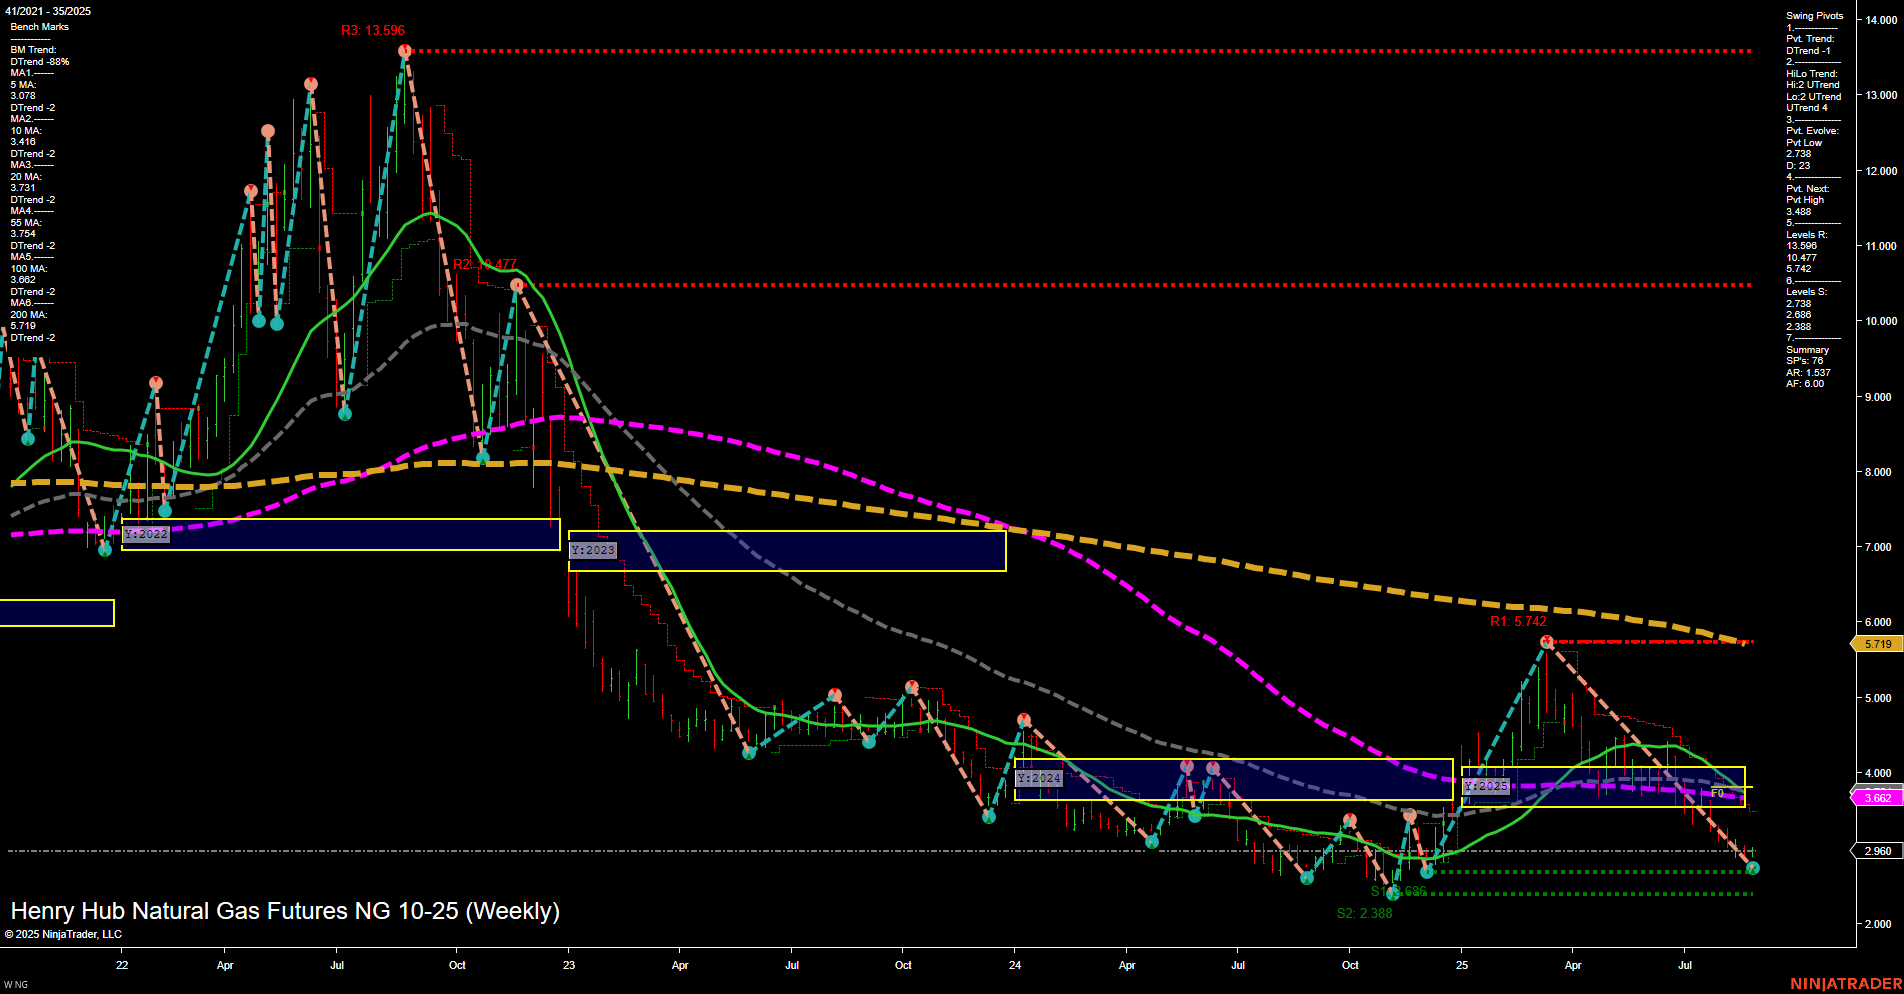
NG Henry Hub Natural Gas Futures Weekly Chart Analysis: 2025-Aug-29 07:10 CT
Price Action
- Last: 2.960,
- Bars: Medium,
- Mom: Momentum slow.
WSFG Weekly
- Short-Term
- WSFG Current: NA%
- F0%/NTZ' Bias: Price Neutral,
- WSFG Trend: Neutral.
MSFG Month Aug
- Intermediate-Term
- MSFG Current: NA%
- F0%/NTZ' Bias: Price Neutral,
- MSFG Trend: Neutral.
YSFG Year 2025
- Long-Term
- YSFG Current: NA%
- F0%/NTZ' Bias: Price Neutral,
- YSFG Trend: Neutral.
Swing Pivots
- (Short-Term) 1. Pvt. Trend: DTrend,
- (Intermediate-Term) 2. HiLo Trend: UTrend,
- 3. Pvt. Evolve: Pvt low 2.738,
- 4. Pvt. Next: Pvt high 5.742,
- 5. Levels R: 13.596, 10.477, 5.742,
- 6. Levels S: 2.738, 2.388, 2.288.
Weekly Benchmarks
- (Intermediate-Term) 5 Week: 3.078 Down Trend,
- (Intermediate-Term) 10 Week: 3.146 Down Trend,
- (Long-Term) 20 Week: 3.662 Down Trend,
- (Long-Term) 55 Week: 4.570 Down Trend,
- (Long-Term) 100 Week: 5.719 Down Trend,
- (Long-Term) 200 Week: 6.470 Down Trend.
Recent Trade Signals
- 27 Aug 2025: Long NG 10-25 @ 2.888 Signals.USAR.TR120
- 25 Aug 2025: Short NG 09-25 @ 2.655 Signals.USAR-WSFG
Overall Rating
- Short-Term: Bearish,
- Intermediate-Term: Neutral,
- Long-Term: Bearish.
Key Insights Summary
The weekly chart for NG Henry Hub Natural Gas Futures shows a market in a prolonged downtrend, with price action currently consolidating near multi-year lows. The last price of 2.960 is below all major moving averages, which are aligned in a persistent downtrend across all timeframes, confirming long-term bearish momentum. Short-term swing pivots indicate a downward trend, while intermediate-term pivots show a potential for upward correction, but this is not yet confirmed by price action or moving averages. Resistance levels remain far overhead, with the nearest at 5.742, while support is clustered just below current prices, suggesting a critical test of the 2.738–2.288 zone. Recent trade signals reflect mixed short-term activity, but the overall technical structure remains weak. The market is in a phase of low momentum and volatility, with no clear breakout or reversal pattern evident. This environment is typical of late-stage downtrends or basing formations, where price may continue to chop sideways or test lower supports before any sustained recovery.
Chart Analysis ATS AI Generated: 2025-08-29 07:11 for Informational use only, not trading advice. Terms and Risk Disclosure Copyright © 2025. Algo Trading Systems LLC.
