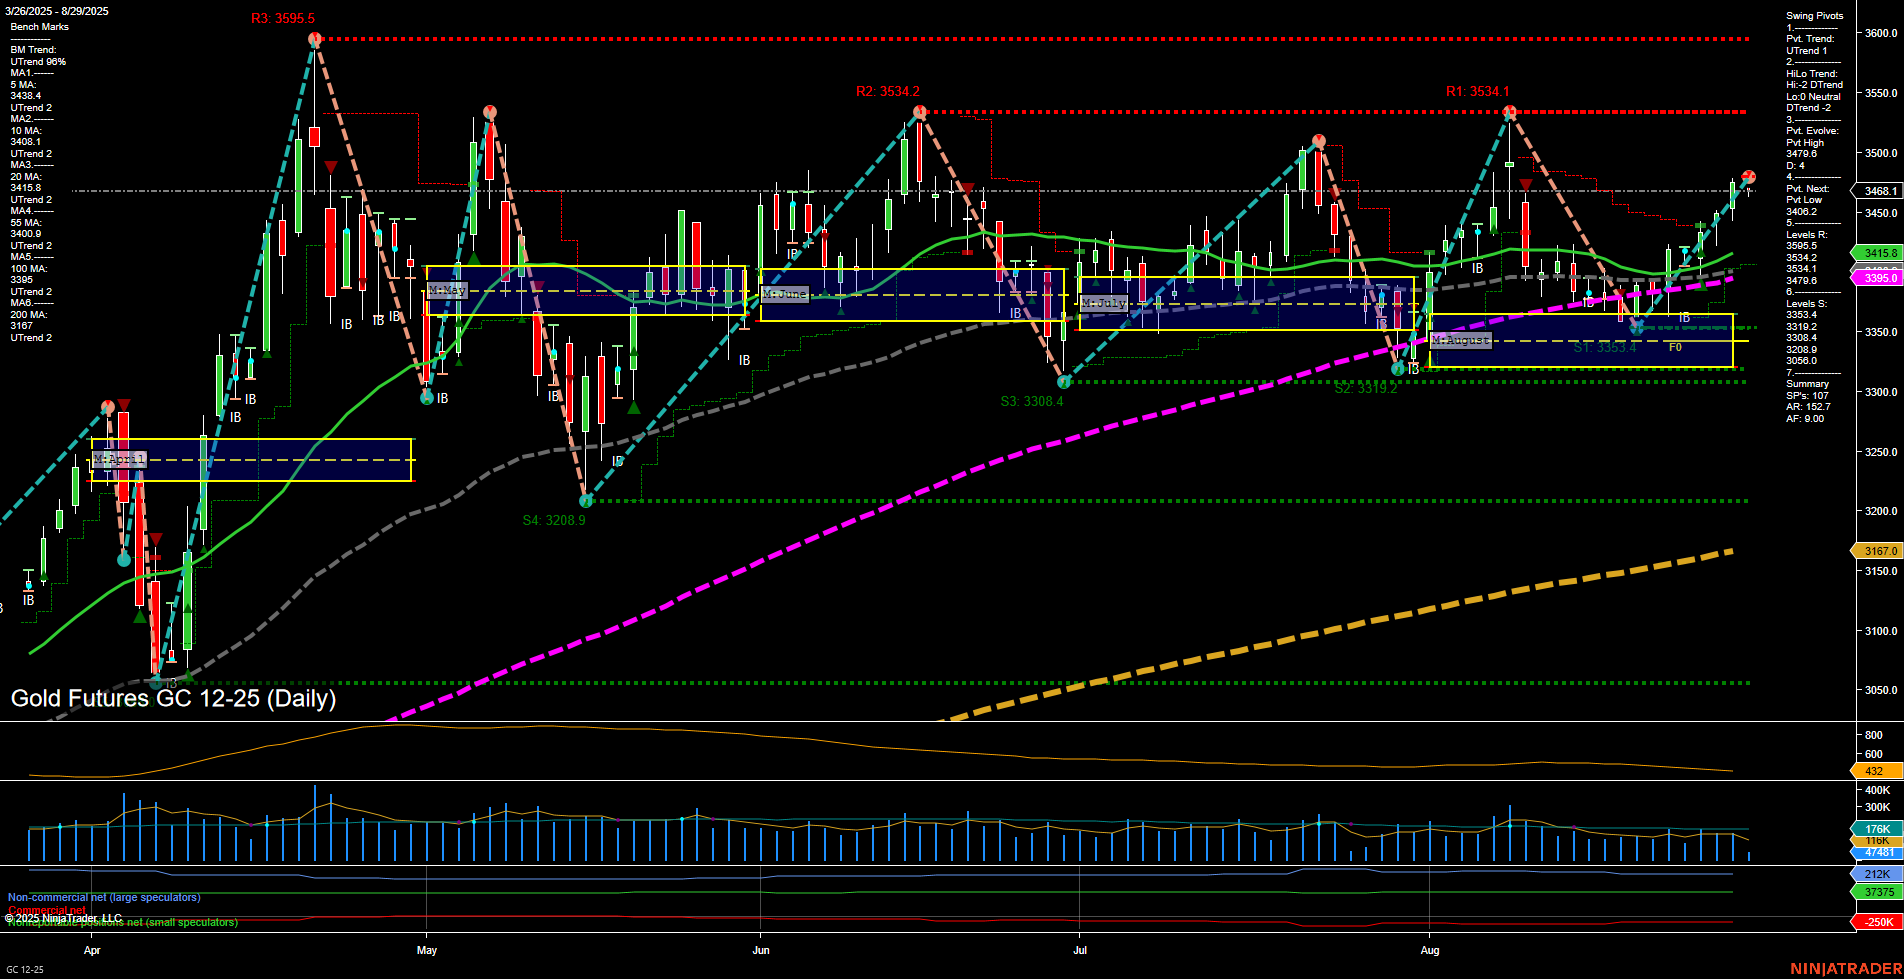
GC Gold Futures Daily Chart Analysis: 2025-Aug-29 07:08 CT
Price Action
- Last: 3468.9,
- Bars: Medium,
- Mom: Momentum average.
WSFG Weekly
- Short-Term
- WSFG Current: 53%
- F0%/NTZ' Bias: Price Above,
- WSFG Trend: Up.
MSFG Month Aug
- Intermediate-Term
- MSFG Current: 52%
- F0%/NTZ' Bias: Price Above,
- MSFG Trend: Up.
YSFG Year 2025
- Long-Term
- YSFG Current: 193%
- F0%/NTZ' Bias: Price Above,
- YSFG Trend: Up.
Swing Pivots
- (Short-Term) 1. Pvt. Trend: UTrend,
- (Intermediate-Term) 2. HiLo Trend: DTrend,
- 3. Pvt. Evolve: Pvt High 3470.9,
- 4. Pvt. Next: Pvt Low 3402.8,
- 5. Levels R: 3595.5, 3534.2, 3534.1,
- 6. Levels S: 3308.4, 3208.9, 3319.2, 3205.6.
Daily Benchmarks
- (Short-Term) 5 Day: 3448.4 Up Trend,
- (Short-Term) 10 Day: 3408.1 Up Trend,
- (Intermediate-Term) 20 Day: 3415.8 Up Trend,
- (Intermediate-Term) 55 Day: 3395.0 Up Trend,
- (Long-Term) 100 Day: 3361.7 Up Trend,
- (Long-Term) 200 Day: 3167.0 Up Trend.
Additional Metrics
Recent Trade Signals
- 28 Aug 2025: Long GC 12-25 @ 3465.8 Signals.USAR.TR720
- 27 Aug 2025: Long GC 12-25 @ 3429.8 Signals.USAR-WSFG
Overall Rating
- Short-Term: Bullish,
- Intermediate-Term: Neutral,
- Long-Term: Bullish.
Key Insights Summary
Gold futures are exhibiting a strong bullish structure in both the short- and long-term timeframes, with price action holding above all key moving averages and the monthly/weekly session fib grids. The current swing pivot trend is up, and recent trade signals confirm renewed upside momentum. However, the intermediate-term HiLo trend remains down, suggesting the market is still digesting a prior correction phase, possibly forming a higher low. Resistance levels are clustered above at 3534–3595, while support is well established below 3319–3208. Volatility is moderate, and volume is steady, indicating healthy participation. The overall setup reflects a market in the process of resuming its uptrend after a period of consolidation, with potential for further gains if resistance levels are overcome.
Chart Analysis ATS AI Generated: 2025-08-29 07:09 for Informational use only, not trading advice. Terms and Risk Disclosure Copyright © 2025. Algo Trading Systems LLC.
