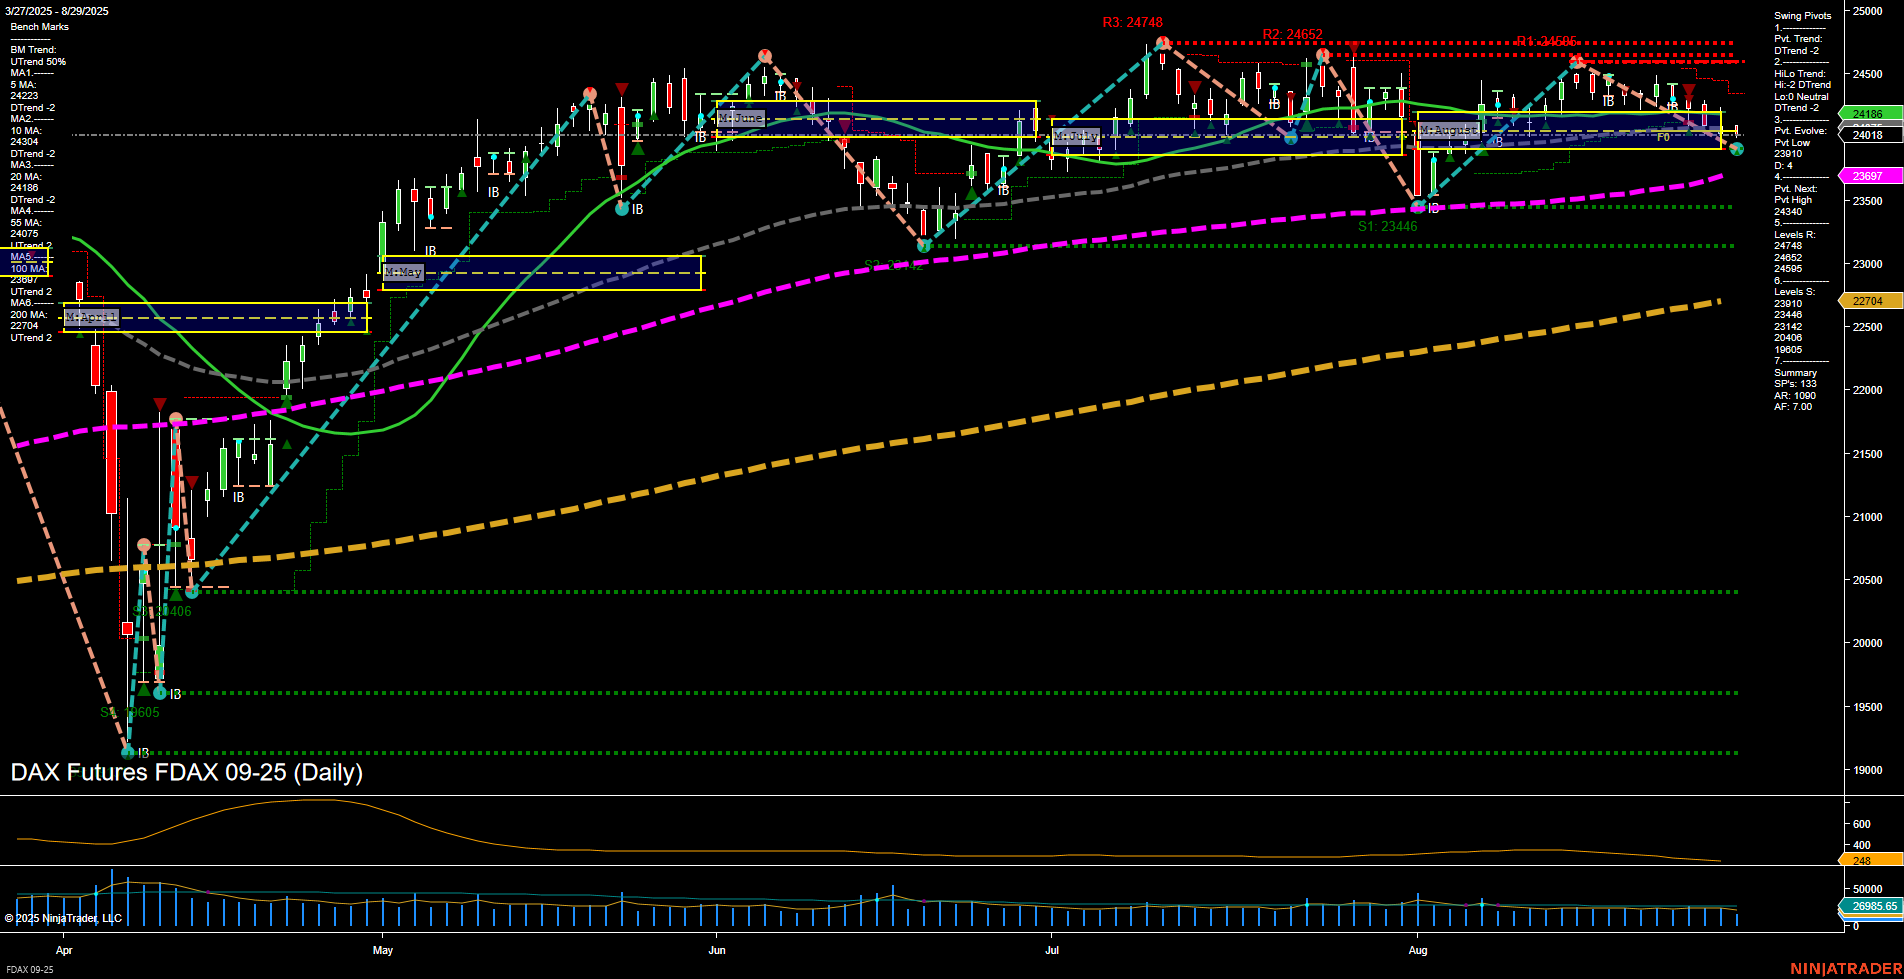
FDAX DAX Futures Daily Chart Analysis: 2025-Aug-29 07:07 CT
Price Action
- Last: 24186,
- Bars: Medium,
- Mom: Momentum slow.
WSFG Weekly
- Short-Term
- WSFG Current: -53%
- F0%/NTZ' Bias: Price Below,
- WSFG Trend: Down.
MSFG Month Aug
- Intermediate-Term
- MSFG Current: 1%
- F0%/NTZ' Bias: Price Above,
- MSFG Trend: Up.
YSFG Year 2025
- Long-Term
- YSFG Current: 108%
- F0%/NTZ' Bias: Price Above,
- YSFG Trend: Up.
Swing Pivots
- (Short-Term) 1. Pvt. Trend: DTrend,
- (Intermediate-Term) 2. HiLo Trend: DTrend,
- 3. Pvt. Evolve: Pvt Low 24106,
- 4. Pvt. Next: Pvt High 24340,
- 5. Levels R: 24785, 24652, 24586, 24340,
- 6. Levels S: 24106, 23416, 22910, 22704, 20440, 19605, 17406.
Daily Benchmarks
- (Short-Term) 5 Day: 24223 Down Trend,
- (Short-Term) 10 Day: 24304 Down Trend,
- (Intermediate-Term) 20 Day: 24186 Down Trend,
- (Intermediate-Term) 55 Day: 23967 Up Trend,
- (Long-Term) 100 Day: 24014 Up Trend,
- (Long-Term) 200 Day: 22704 Up Trend.
Additional Metrics
Recent Trade Signals
- 26 Aug 2025: Short FDAX 09-25 @ 24253 Signals.USAR-WSFG
Overall Rating
- Short-Term: Bearish,
- Intermediate-Term: Neutral,
- Long-Term: Bullish.
Key Insights Summary
The FDAX is currently experiencing a short-term pullback, with price action showing slow momentum and medium-sized bars, indicating a lack of strong conviction in either direction. The weekly session fib grid (WSFG) trend is down, and price is below the NTZ, reinforcing a bearish short-term outlook. Swing pivots confirm this with a current downtrend and the next key resistance at 24340, while support sits at 24106 and lower. However, the intermediate-term (monthly) and long-term (yearly) fib grid trends remain up, with price above their respective NTZs, suggesting the broader trend is still intact. Moving averages show short-term pressure (5, 10, and 20-day MAs trending down), but intermediate and long-term MAs (55, 100, 200-day) are still in uptrends, providing a supportive backdrop. Volatility (ATR) and volume (VOLMA) are moderate, and the most recent trade signal was a short entry, aligning with the short-term bearish bias. Overall, the market is in a corrective phase within a larger uptrend, with the potential for further downside in the short term before a possible resumption of the broader bullish trend if key supports hold.
Chart Analysis ATS AI Generated: 2025-08-29 07:07 for Informational use only, not trading advice. Terms and Risk Disclosure Copyright © 2025. Algo Trading Systems LLC.
