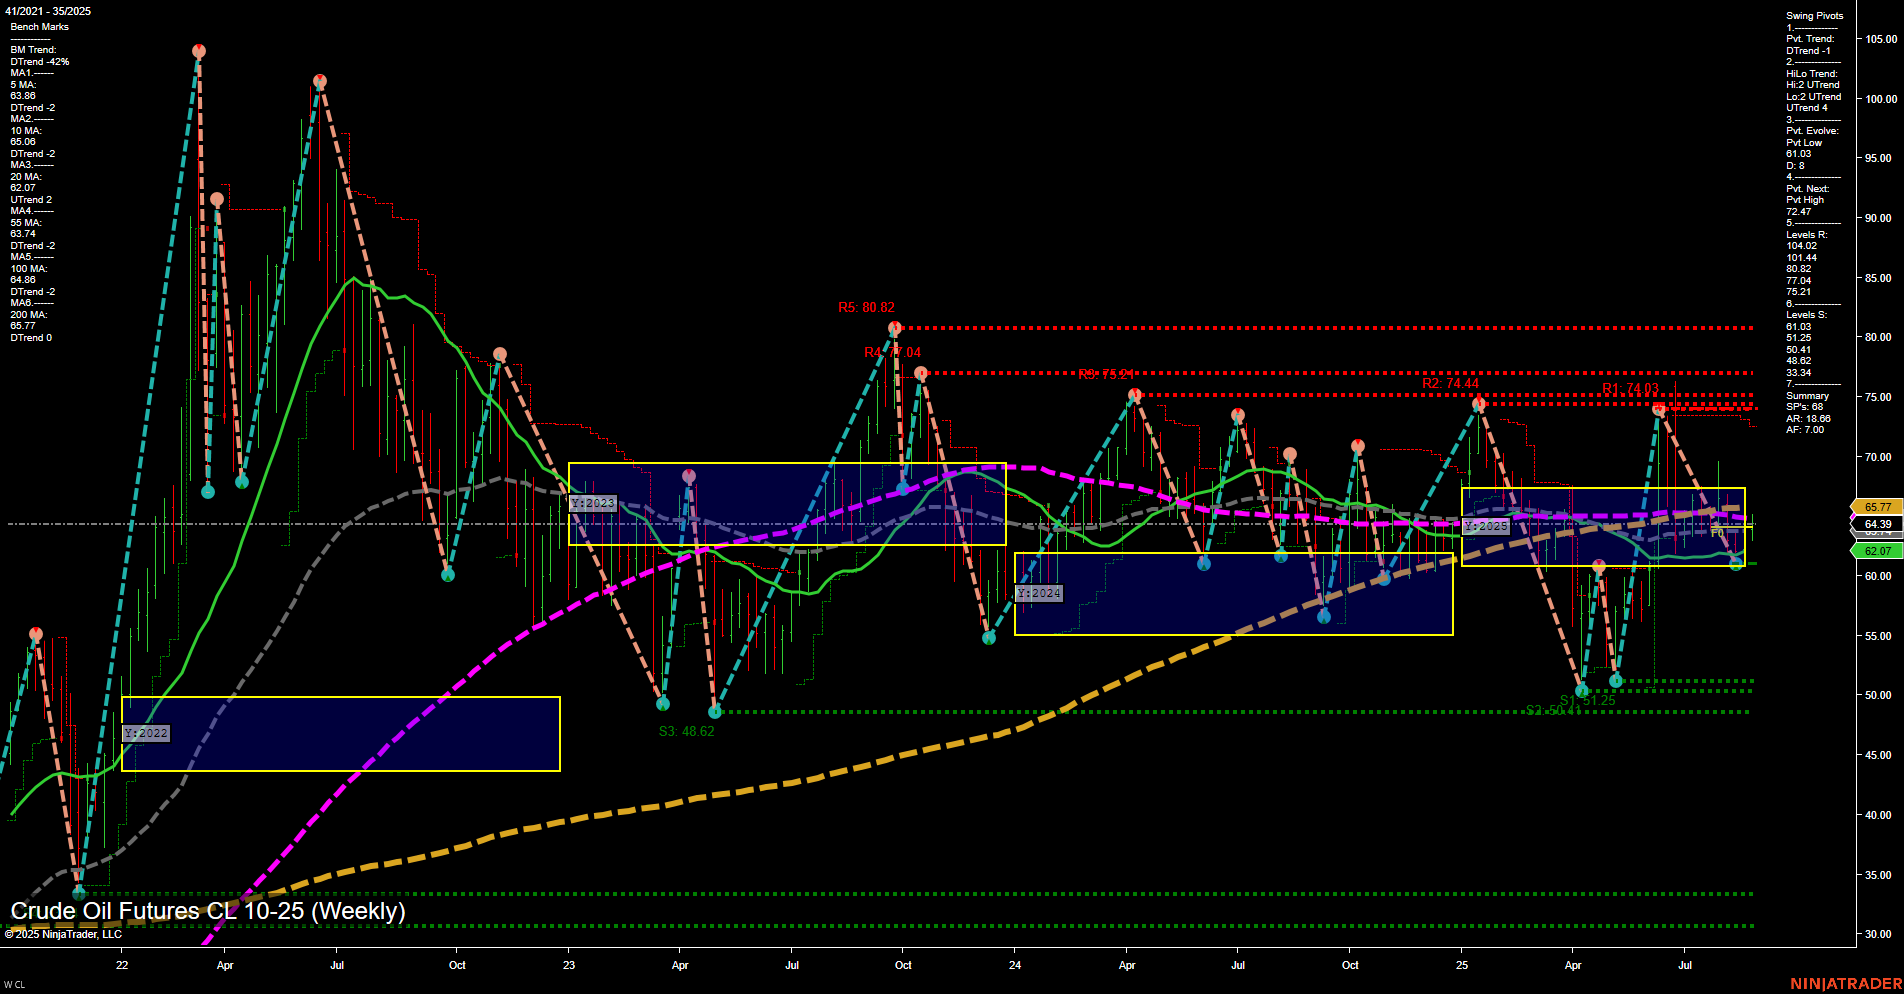
CL Crude Oil Futures Weekly Chart Analysis: 2025-Aug-29 07:04 CT
Price Action
- Last: 64.39,
- Bars: Medium,
- Mom: Momentum slow.
WSFG Weekly
- Short-Term
- WSFG Current: 16%
- F0%/NTZ' Bias: Price Above,
- WSFG Trend: Up.
MSFG Month Aug
- Intermediate-Term
- MSFG Current: -35%
- F0%/NTZ' Bias: Price Below,
- MSFG Trend: Down.
YSFG Year 2025
- Long-Term
- YSFG Current: 1%
- F0%/NTZ' Bias: Price Above,
- YSFG Trend: Up.
Swing Pivots
- (Short-Term) 1. Pvt. Trend: DTrend,
- (Intermediate-Term) 2. HiLo Trend: UTrend,
- 3. Pvt. Evolve: Pvt low 61.25,
- 4. Pvt. Next: Pvt high 74.03,
- 5. Levels R: 101.04, 80.82, 75.94, 74.44, 74.03,
- 6. Levels S: 61.25, 60.41, 59.32, 53.43, 48.62.
Weekly Benchmarks
- (Intermediate-Term) 5 Week: 65.34 Down Trend,
- (Intermediate-Term) 10 Week: 65.77 Down Trend,
- (Long-Term) 20 Week: 64.39 Up Trend,
- (Long-Term) 55 Week: 62.07 Up Trend,
- (Long-Term) 100 Week: 65.88 Down Trend,
- (Long-Term) 200 Week: 60.77 Up Trend.
Recent Trade Signals
- 29 Aug 2025: Long CL 10-25 @ 64.26 Signals.USAR-WSFG
- 28 Aug 2025: Long CL 10-25 @ 64.08 Signals.USAR.TR120
Overall Rating
- Short-Term: Neutral,
- Intermediate-Term: Bearish,
- Long-Term: Bullish.
Key Insights Summary
Crude oil futures are currently trading in a consolidation zone, with price action showing medium-sized bars and slow momentum, indicating a lack of strong directional conviction. The short-term WSFG trend is up, with price holding above the NTZ center, but the swing pivot trend is down, suggesting recent weakness. Intermediate-term signals are bearish, as the MSFG trend is down and both the 5- and 10-week moving averages are trending lower, reflecting ongoing pressure from recent pullbacks. However, the long-term outlook remains bullish, supported by the uptrend in the 20-, 55-, and 200-week moving averages and the yearly session grid trend. Key resistance levels are clustered in the mid-70s to low-80s, while support is firm in the low 60s and upper 50s. Recent trade signals have triggered long entries, hinting at potential for a bounce or reversal, but the market remains choppy and range-bound, with no clear breakout yet. Overall, the market is in a transition phase, with short-term neutrality, intermediate-term bearishness, and long-term bullish structure.
Chart Analysis ATS AI Generated: 2025-08-29 07:04 for Informational use only, not trading advice. Terms and Risk Disclosure Copyright © 2025. Algo Trading Systems LLC.
