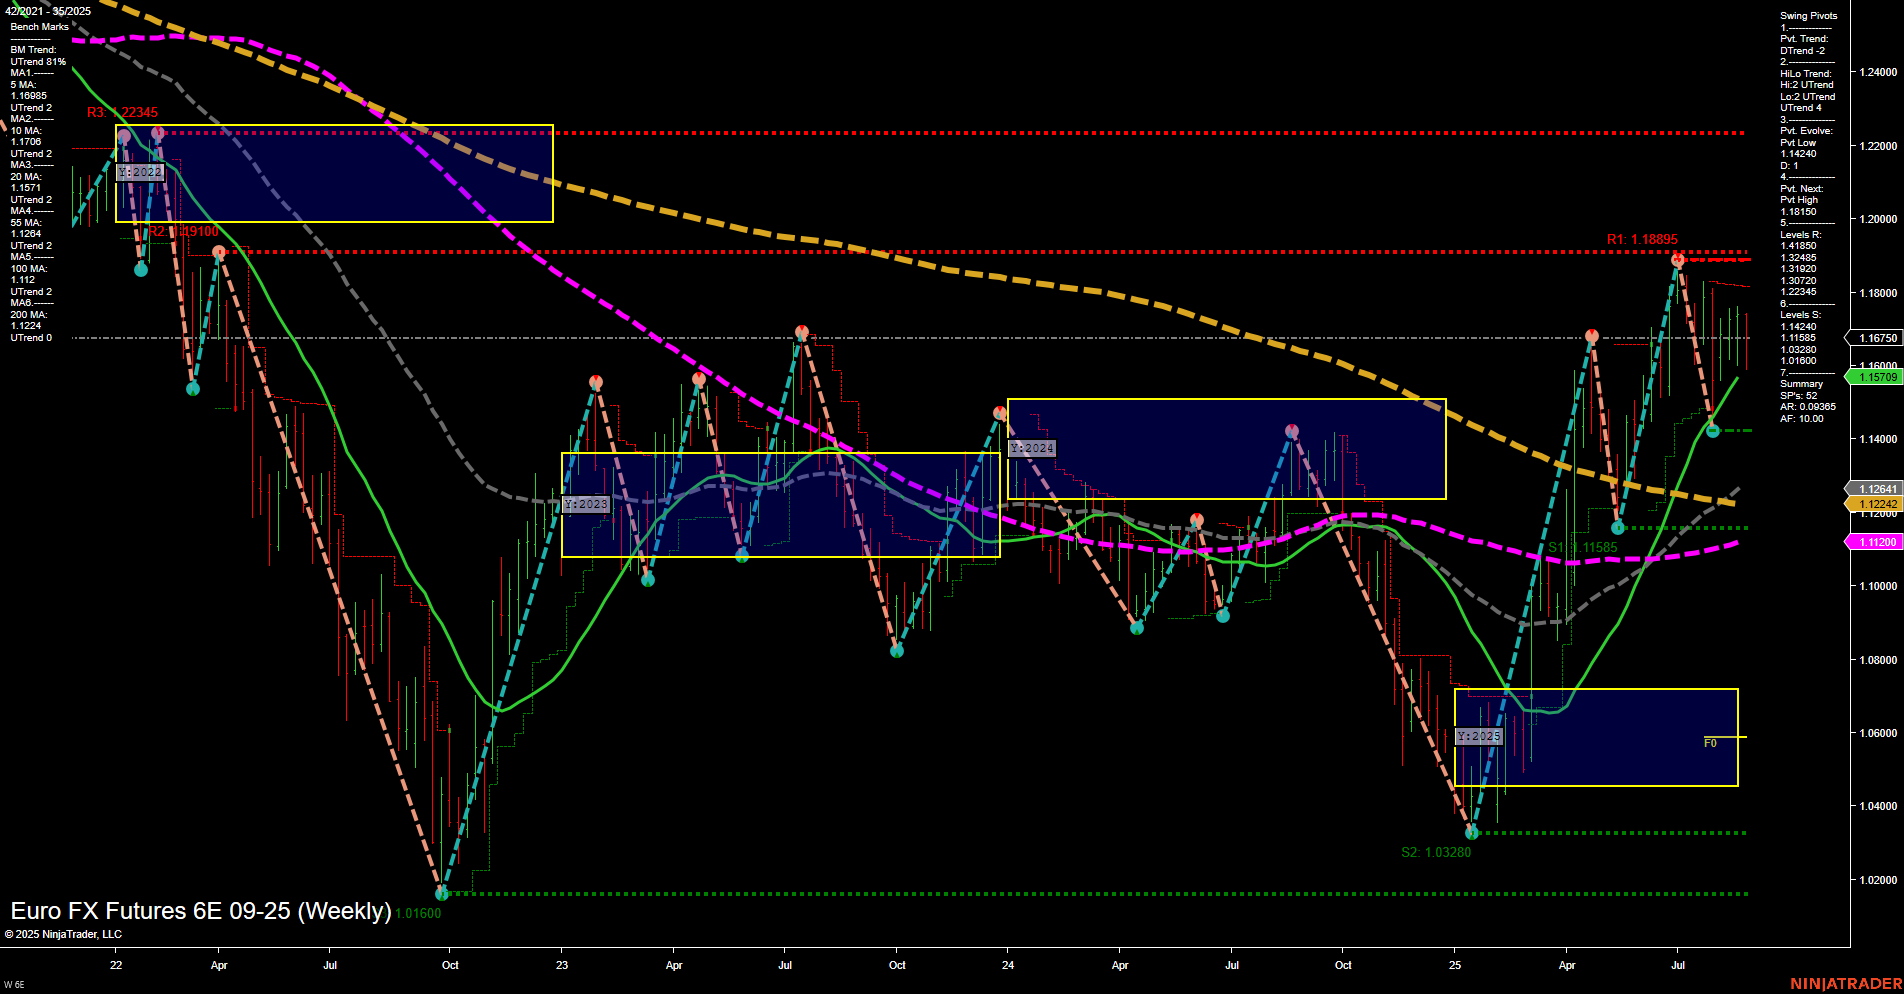
6E Euro FX Futures Weekly Chart Analysis: 2025-Aug-29 07:02 CT
Price Action
- Last: 1.16750,
- Bars: Medium,
- Mom: Momentum average.
WSFG Weekly
- Short-Term
- WSFG Current: -38%
- F0%/NTZ' Bias: Price Below,
- WSFG Trend: Down.
MSFG Month Aug
- Intermediate-Term
- MSFG Current: 54%
- F0%/NTZ' Bias: Price Above,
- MSFG Trend: Up.
YSFG Year 2025
- Long-Term
- YSFG Current: 82%
- F0%/NTZ' Bias: Price Above,
- YSFG Trend: Up.
Swing Pivots
- (Short-Term) 1. Pvt. Trend: DTrend,
- (Intermediate-Term) 2. HiLo Trend: UTrend,
- 3. Pvt. Evolve: Pvt low 1.14240,
- 4. Pvt. Next: Pvt high 1.18895,
- 5. Levels R: 1.18895, 1.18150, 1.17540,
- 6. Levels S: 1.14240, 1.11585, 1.03280.
Weekly Benchmarks
- (Intermediate-Term) 5 Week: 1.16843 Down Trend,
- (Intermediate-Term) 10 Week: 1.17002 Down Trend,
- (Long-Term) 20 Week: 1.15709 Up Trend,
- (Long-Term) 55 Week: 1.12641 Up Trend,
- (Long-Term) 100 Week: 1.11220 Up Trend,
- (Long-Term) 200 Week: 1.12424 Down Trend.
Recent Trade Signals
- 28 Aug 2025: Long 6E 09-25 @ 1.16835 Signals.USAR.TR120
- 22 Aug 2025: Long 6E 09-25 @ 1.1754 Signals.USAR-WSFG
Overall Rating
- Short-Term: Bearish,
- Intermediate-Term: Bullish,
- Long-Term: Bullish.
Key Insights Summary
The 6E Euro FX Futures weekly chart shows a complex interplay of trends across timeframes. Short-term price action is under pressure, with the WSFG trend down and price below the NTZ, supported by a DTrend in the short-term swing pivots and both 5- and 10-week moving averages trending down. However, the intermediate-term outlook is constructive, with the MSFG trend up, price above the monthly NTZ, and the HiLo swing trend up, suggesting a recovery phase or ongoing rally. Long-term signals remain bullish, as the YSFG is strongly up, price is well above the yearly NTZ, and most long-term moving averages are in uptrends. Key resistance sits at 1.18895 and 1.18150, while support is found at 1.14240 and 1.11585. Recent trade signals have triggered long entries, indicating attempts to capture a potential bounce or trend continuation. The market is currently navigating a pullback within a broader uptrend, with volatility and choppy price action likely as it tests key resistance and support levels.
Chart Analysis ATS AI Generated: 2025-08-29 07:02 for Informational use only, not trading advice. Terms and Risk Disclosure Copyright © 2025. Algo Trading Systems LLC.
