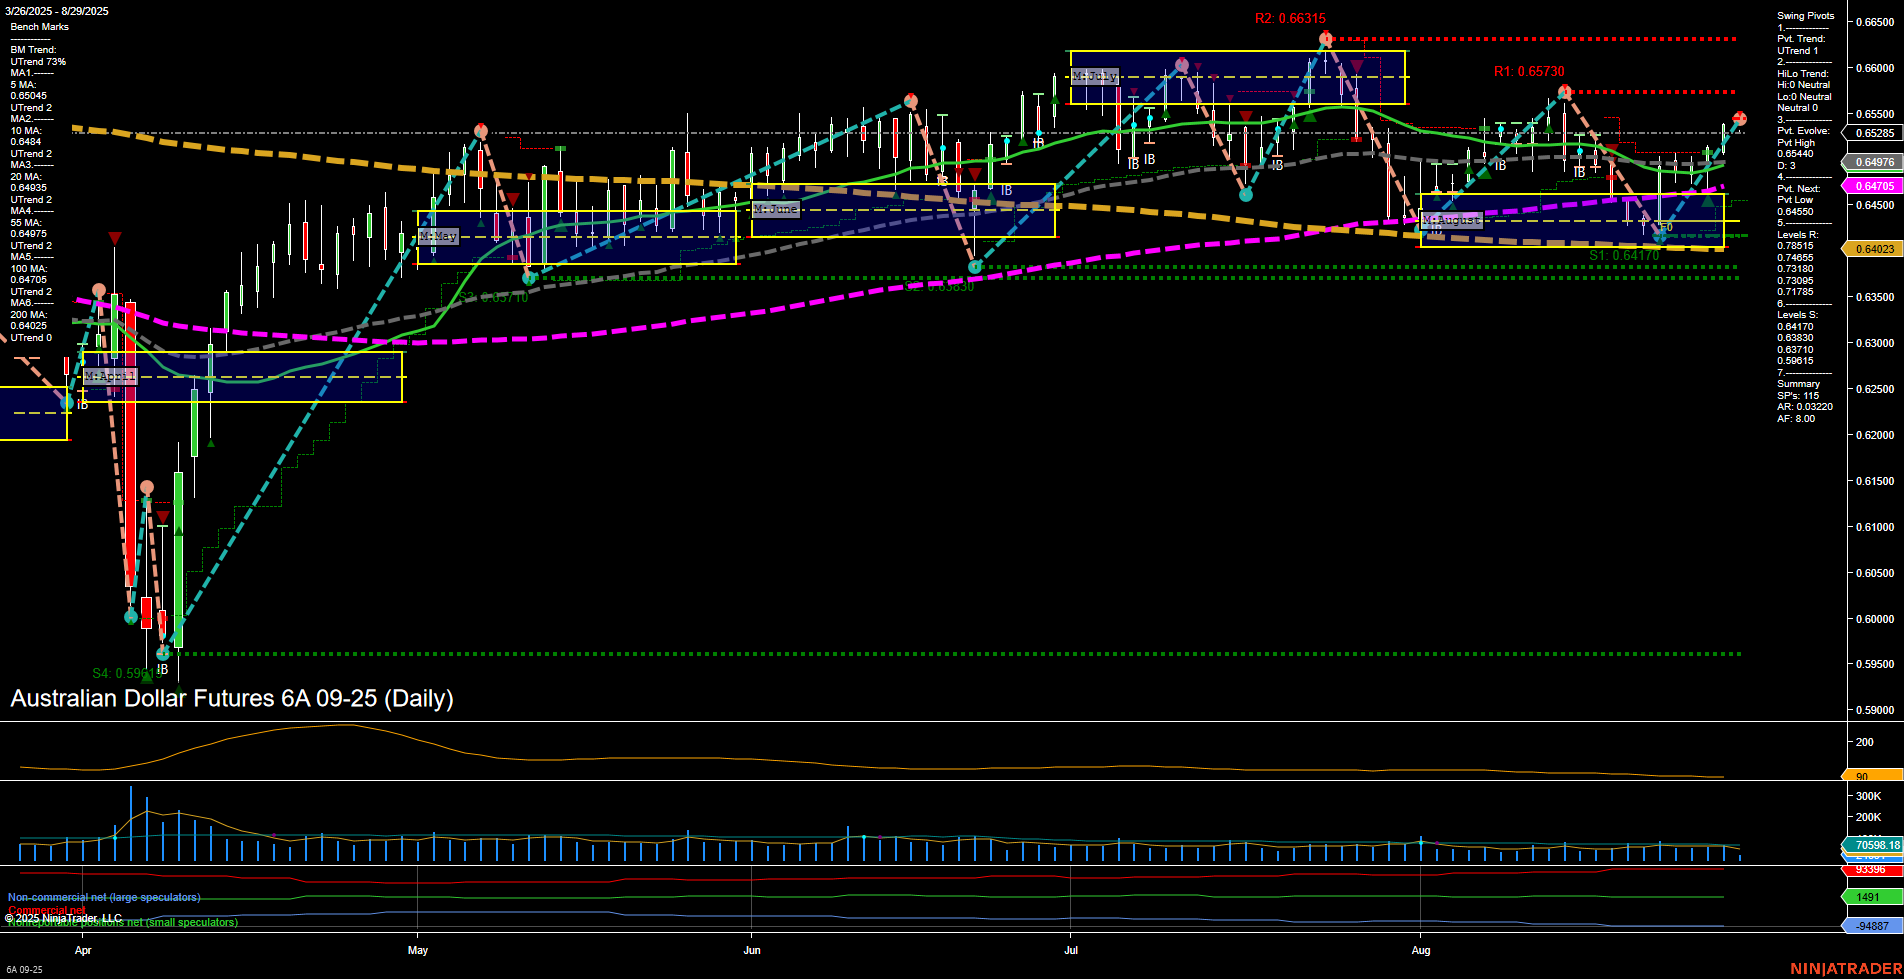
6A Australian Dollar Futures Daily Chart Analysis: 2025-Aug-29 07:00 CT
Price Action
- Last: 0.65285,
- Bars: Medium,
- Mom: Momentum average.
WSFG Weekly
- Short-Term
- WSFG Current: NA%
- F0%/NTZ' Bias: Price Neutral,
- WSFG Trend: Neutral.
MSFG Month Aug
- Intermediate-Term
- MSFG Current: NA%
- F0%/NTZ' Bias: Price Neutral,
- MSFG Trend: Neutral.
YSFG Year 2025
- Long-Term
- YSFG Current: NA%
- F0%/NTZ' Bias: Price Neutral,
- YSFG Trend: Neutral.
Swing Pivots
- (Short-Term) 1. Pvt. Trend: UTrend,
- (Intermediate-Term) 2. HiLo Trend: UTrend,
- 3. Pvt. Evolve: Pvt High 0.65440,
- 4. Pvt. Next: Pvt Low 0.64550,
- 5. Levels R: 0.66315, 0.65730, 0.65440,
- 6. Levels S: 0.64550, 0.64170, 0.64025.
Daily Benchmarks
- (Short-Term) 5 Day: 0.65045 Up Trend,
- (Short-Term) 10 Day: 0.64842 Up Trend,
- (Intermediate-Term) 20 Day: 0.64976 Up Trend,
- (Intermediate-Term) 55 Day: 0.64705 Up Trend,
- (Long-Term) 100 Day: 0.64023 Up Trend,
- (Long-Term) 200 Day: 0.64203 Down Trend.
Additional Metrics
Recent Trade Signals
- 28 Aug 2025: Long 6A 09-25 @ 0.65325 Signals.USAR.TR720
- 28 Aug 2025: Long 6A 09-25 @ 0.6514 Signals.USAR-WSFG
- 22 Aug 2025: Long 6A 09-25 @ 0.64975 Signals.USAR.TR120
- 22 Aug 2025: Short 6A 09-25 @ 0.64185 Signals.USAR-MSFG
Overall Rating
- Short-Term: Bullish,
- Intermediate-Term: Bullish,
- Long-Term: Neutral.
Key Insights Summary
The Australian Dollar Futures (6A) daily chart as of late August 2025 shows a market transitioning into a bullish phase on both short- and intermediate-term horizons. Price action is characterized by medium-sized bars and average momentum, indicating a steady but not aggressive move higher. The swing pivot structure confirms an uptrend, with the most recent pivot high at 0.65440 and the next key support at 0.64550. Resistance levels are layered above at 0.65440, 0.65730, and 0.66315, while support is established at 0.64550, 0.64170, and 0.64025.
All short- and intermediate-term moving averages (5, 10, 20, 55, 100-day) are trending up, reinforcing the bullish bias, though the 200-day remains in a downtrend, suggesting the longer-term trend is still neutral and has not fully reversed. The ATR and volume metrics indicate moderate volatility and healthy participation.
Recent trade signals have favored the long side, with multiple long entries in late August, aligning with the current uptrend. The market appears to be in a recovery or continuation phase, possibly following a period of consolidation or a pullback. There is no clear breakout yet above major resistance, but the structure supports further upside if momentum persists. The overall environment is constructive for swing traders looking for trend continuation, with a watchful eye on resistance levels for potential pauses or reversals.
Chart Analysis ATS AI Generated: 2025-08-29 07:00 for Informational use only, not trading advice. Terms and Risk Disclosure Copyright © 2025. Algo Trading Systems LLC.
